Gold Price Forecast: XAUUSD readies for a rebound towards $1,722 – Confluence Detector
- Gold Price struggles around YTD low as hawkish Fed bets, recession fears ebb.
- US dollar bulls take a breather at a multi-year high as traders await important consumer-centric data.
- XAUUSD appears lucrative for short-term buying until staying beyond $1,705.

Gold Price (XAUUSD) stays defensive at around $1,700, consolidating recent losses near the lowest levels in 11 months as risk-aversion fades ahead of the key US data. Also contributing to the corrective pullback could be the reduction in the hawkish Fed bets and easing the inversion gap of the key US Treasury yield curves, namely between 2-year and 10-year bonds. It’s worth noting, however, that the firmer US Producer Price Index (PPI) and downbeat economics from China keep gold sellers hopeful as they await US Retail Sales for June and preliminary readings of the Michigan Consumer Sentiment Index (CSI) for July.
Also read: Gold Price aims to recapture $1,700 as DXY hopes for a rebound, US Michigan CSI eyed
Gold Price: Key levels to watch
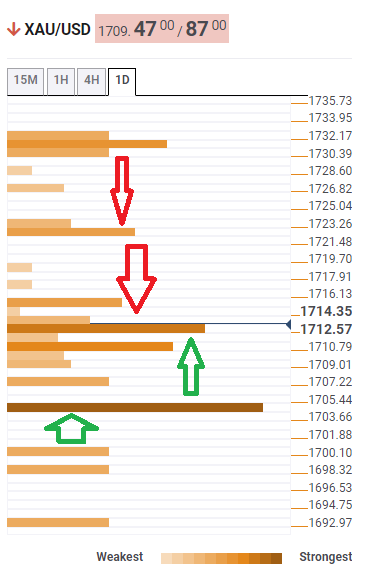
The Technical Confluence Detector shows that Gold Price is in its nascent stage of recovery as it recently crossed the $1,713 hurdle comprising the previous hour on four-hour and Fibonacci 38.2% on one-day.
Also keeping the XAUUSD buyers hopeful is the metal sustained trading beyond the key resistance-turned-support around $1,705, including Pivot Point S3 one-month and lower band of the Bollinger on one-hour.
It’s worth noting that the gold seller’s dominance past $1,705 needs validation from the $1,700 threshold that coincides lower band of the Bollinger on one-day, as well as the previous daily bottom.
That said, the gold buyers are all set to poke the $1,724 resistance mark where Fibonacci 61.8% one-day joins 50-HMA and SMA-10 in four-hour.
Should the metal prices remain firmer past $1,724, the odds of witnessing a run-up towards $1,732, including the previous weekly low and Pivot Point R1 on one-day, can’t be ruled out.
Overall, Gold Price lures intraday buyers but the bearish trend is yet to be rejected.
Here is how it looks on the tool
About Technical Confluences Detector
The TCD (Technical Confluences Detector) is a tool to locate and point out those price levels where there is a congestion of indicators, moving averages, Fibonacci levels, Pivot Points, etc. If you are a short-term trader, you will find entry points for counter-trend strategies and hunt a few points at a time. If you are a medium-to-long-term trader, this tool will allow you to know in advance the price levels where a medium-to-long-term trend may stop and rest, where to unwind positions, or where to increase your position size.
Author

Anil Panchal
FXStreet
Anil Panchal has nearly 15 years of experience in tracking financial markets. With a keen interest in macroeconomics, Anil aptly tracks global news/updates and stays well-informed about the global financial moves and their implications.


