Gold Price Forecast: XAUUSD pressured, US real yields turn positive first time since 2020
- Bets for more aggressive Fed rate hikes, stronger USD prompted some selling around gold.
- The price is embarking on a deeper test of support but leaves behind a compelling reversion M-pattern on the daily chart.
- Traders now look forward to Fedspeak for a fresh impetus and some short-term opportunities.

Gold price fell sharply after touching high of USD2,000/oz on Monday, as US yields flew following stronger than expected US home construction data. The real 10-year US yield has now turned positive for the first time since 2020. real yields and the price of gold are said to have a -0.82 correlation and trade inversely. In other words, when real yields go up gold goes down.
The Federal Reserve Jim Bullard said that the Fed needs to move quickly to raise interest rates to 3.5% by end of this year and a 75bp hike should not be ruled out. However, the geopolitical situation could still offset aggressive rate rises, which is acting like a support structure for gold prices on a daily basis. ''ETF flows continued to be strong, with total holdings rising to a 14-month high of 106.6moz,'' analysts at ANZ Bank said.
Additionally, analysts at TD Securities explained, ''while the Fed is signalling its intent to combat inflation by reaching policy neutrality by year-end, and to start an aggressive QT regime, outflows from gold markets have been scarce as participants are happy to retain some optionality against the Fed's stated plan amid growth concerns.''
However, the gold price is starting to slide deeper toward the second level of resistance near the lows of Tuesday's business day at $1,943.66 which would be expected to hold during initial tests. The gold price moved between a high of $1,982.03 and a low of $1,943.66. It is down 0.1% in Tokyo trade.
Meanwhile, the DXY index was up for the fourth straight day and made a new cycle high near 101.023. The March 2020 high near 103 is the next big target. This index was being supported by the divergence in monetary policy by a Federal Reserve that is determined to keep a lid on soaring inflation.
This has helped the US benchmark 10-year Treasury yields to hit 2.942% on Tuesday, the highest since December 2018 and are on track to test the October 2018 high near 3.26%. ''
All eyes on the Fed
Besides the Hawkish commentary from St Louis Fed President James Bullard on Monday, other Fed speakers, such as Chicago Fed President Charles Evans (who spoke on Tuesday), have taken a slightly softer line, though even Evans projected that the Fed will probably need to take interest rates above the so-called "neutral" rate (which the Fed estimates to be in the 2.25-2.5% area).
Fed Chair Jerome Powell will be speaking on Thursday and is expected to solidify expectations for multiple 50 bps rate hikes at upcoming Fed meetings. If he does live up to the hype, this might encourage further upside in US yields and the US dollar. This raises the opportunity cost of holding non-yielding assets like gold and increased the cost to foreign buyers of USD-denominated commodities and, hence, presents a further downside risk for gold.
However, analysts continued to note that precious metals like silver and gold have help up remarkably well in recent weeks despite the massive rise in US (and global yields) as a result of hawkishly shifting central bank tightening expectations. They attribute safe-haven and inflation/stagflation protection demand as the key factor, with the outbreak of the Russo-Ukraine war (and subsequent sanctions on Russia) expected to dent global growth, spur inflationary pressures and worsen global supply chain snags.
One which note, concerns about a potential further widening of lockdowns in China, which also presents a big stagflationary risk to the global economy (weaker Chinese growth plus longer supply chain dysfunction) have also arguably supported silver and gold as of late. Despite the DXY being more than 2.5% stronger and 10-year US yields having risen nearly 60 bps so far this month, gold still trades with on-the-month gains of about 0.9%.
Gold technical analysis
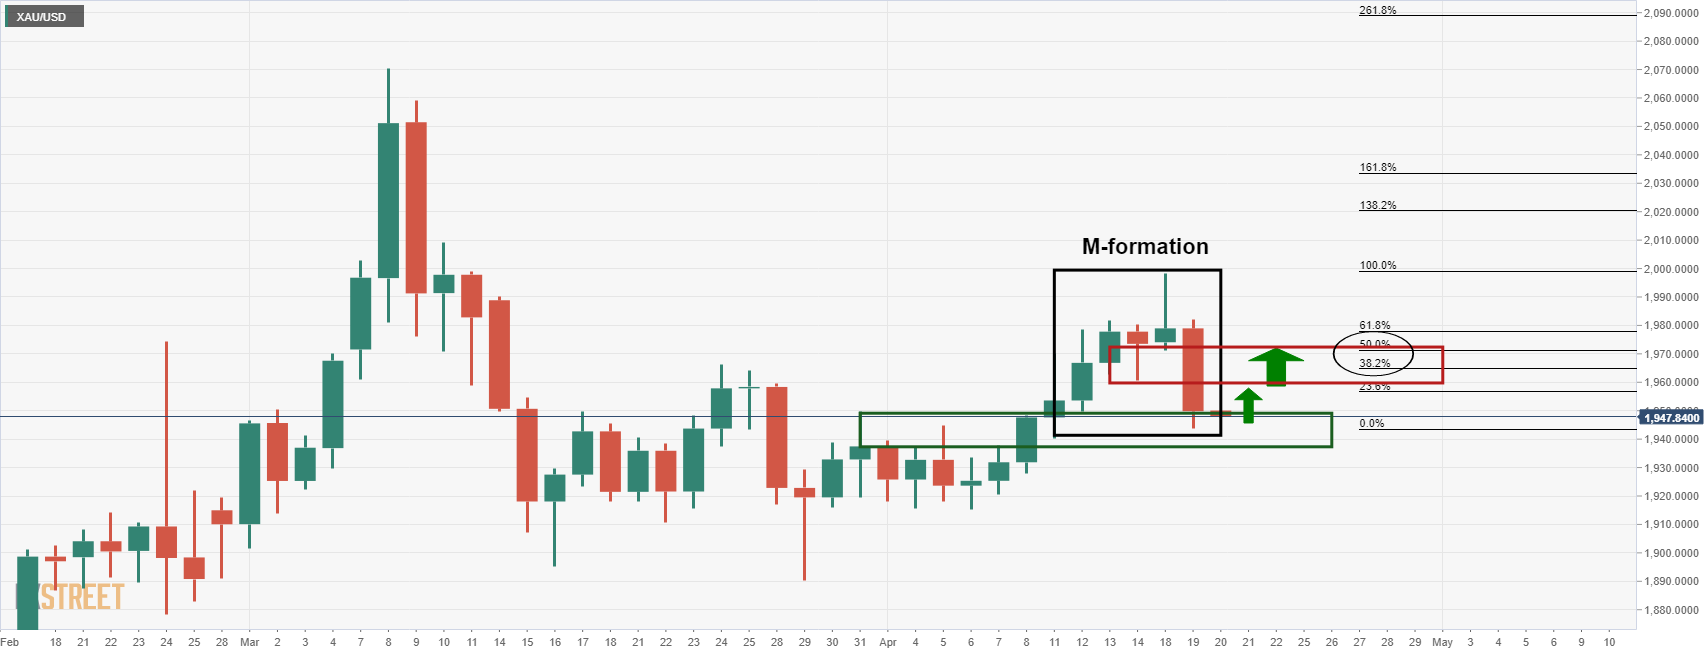
As illustrated on the above daily chart, the price is embarking on a deeper test of the prior resistance structure established in early April of this year. In doing so, it will be leaving behind an M-formation.
This is a reversion pattern whereby the price would be expected to be drawn back into testing the old support. This is otherwise known as the neckline of the pattern. The bulls would be meeting a 38.2% and 50% ratio block between $1,960 and $1,970. If, on the other hand, the price simply continues lower, then $1,915 comes as an important level at that point as the April 6 lows.
Author

Ross J Burland
FXStreet
Ross J Burland, born in England, UK, is a sportsman at heart. He played Rugby and Judo for his county, Kent and the South East of England Rugby team.


