Gold Price Forecast: XAU/USD faces stiff resistance at 200-DMA after US inflation-led $40 rally
- Gold bulls bust through bearish commitments and prints fresh highs for October.
- US dollar gives back significant ground as 30-year US Treasury yields drop heavily.
- Stagflation theme gains traction in markets are cold energy-sapping winter-time approaches.

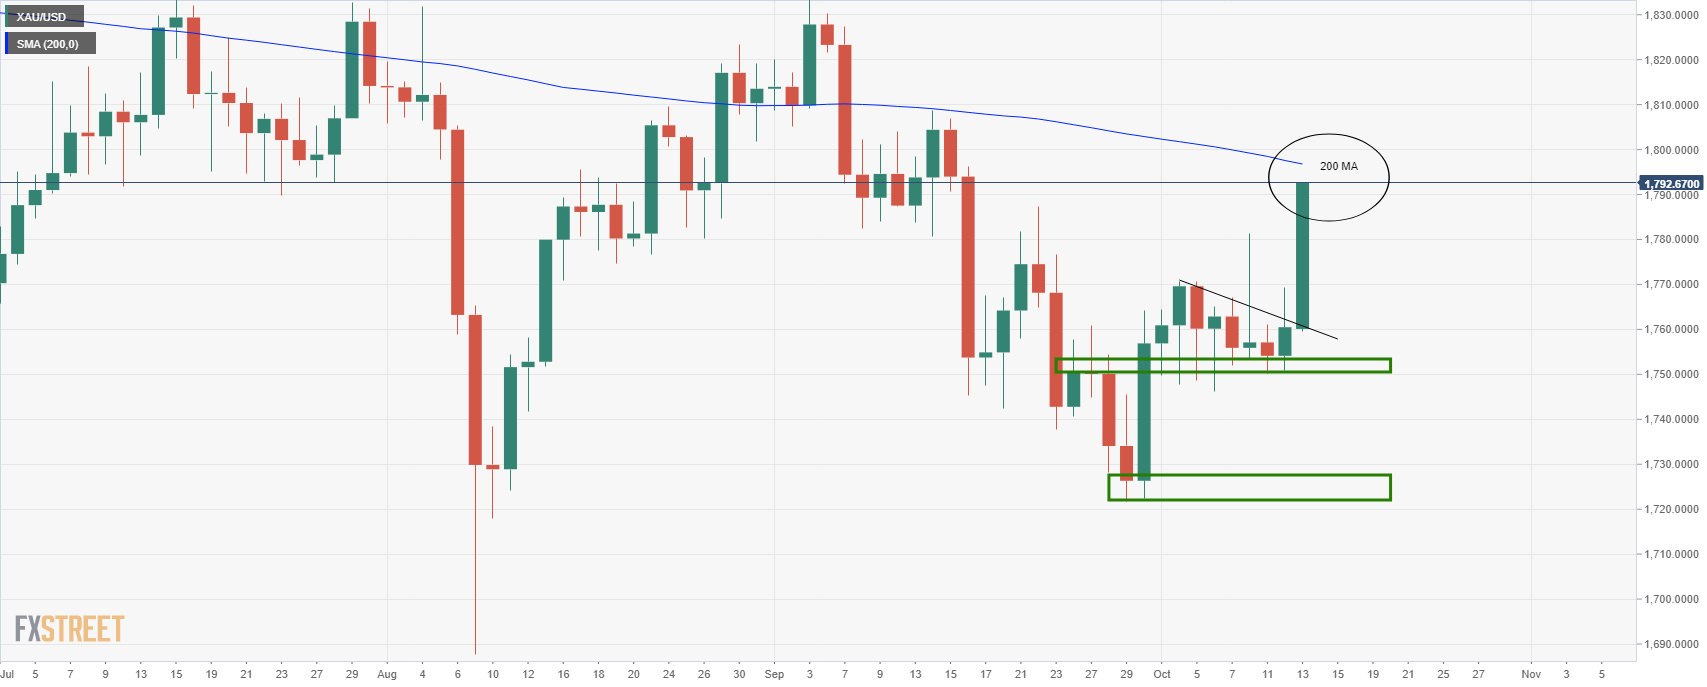
Update: Gold is consolidating Wednesday’s massive gains so far this Thursday, as the bulls face stiff resistance at the mildly bearish 200-Daily Moving Average (DMA), currently at $1796. A renewed uptick in the US Treasury yields across the curve amid a better risk profile is capping the upside in gold price. Markets digest mixed Chinese inflation data, which is having a limited impact on the metal price.
Gold staged a $40 rally after the US Consumer Price Index (CPI) bettered estimates with 5.4% YoY in September, exacerbating the fears over rising inflation and its impact on the economic recovery. However, gold price entered into an upside consolidative mode after the FOMC September meeting minutes revealed that “a gradual tapering process that concluded around the middle of next year would likely be appropriate.”
The attention now turns towards another batch of the US data, with the weekly Jobless Claims and PPI data of relevance. The Fed sentiment and inflationary concerns will continue to play out in the coming days.
Read: US September CPI: Inflation supports a November taper
The price of gold on Wednesday has rallied into key resistance territory where it has printed the highest levels since the weekly bar from the 13 Sep. At the time of writing, gold is trading at $1,792.50 and 1.85% higher. The price has travelled from a low of $1,757.89 to a high of $1,796.24 where it tests the 200-day EMA.
In key data today, US inflation data showed prices rose solidly in September, stoking expectations the Federal Reserve will announce a tapering of stimulus next month, with the potential for rate hikes by mid-2022. The Consumer Price Index rose 0.4% last month, versus a 0.3% rise expected by economists polled by Reuters.
In the 12 months through September, the CPI increased 5.4%, up from a 5.3% year-on-year advance in August, Reuters reported. ''Excluding the volatile food and energy components, the so-called core CPI climbed 0.2% last month, up from 0.1% in August.''
In more recent trade, the Federal Reserve released the minutes from its September meeting which gave the signs for a November announcement for tapering of the central bank's bond-buying stimulus. More on this in the link below:
FOMC Minutes: ''A gradual tapering process would likely be appropriate''
Nonetheless, the greenback has fallen into the fourth position on the Currency Strength Indexes behind GBP and the commodity currencies, AUD and CAD. The move does not tally with the foresight with regards to timings of a US rate hike lift-off though. The market had been pricing in a rate hike for December of next year, but since the CPI data and hawkish Minutes, it is now eyeing September.
However, given how far the US dollar index has come in just a couple of weeks, rising some 1.7% and running into a wall of resistance as per the Sep 2020 highs, a correction is of no surprise, only the timing of it remains the head-scratcher. What is evident, however, is that yield differentials are playing their part, with the 10 and 30-year Treasury yields down 1.5% and 2.5% respectively on the day. ''If the sell-off in rates continues, differentials may start to play a larger role in FX outcomes,'' analysts at ANZ Bank argued.
US dollar index, monthly chart
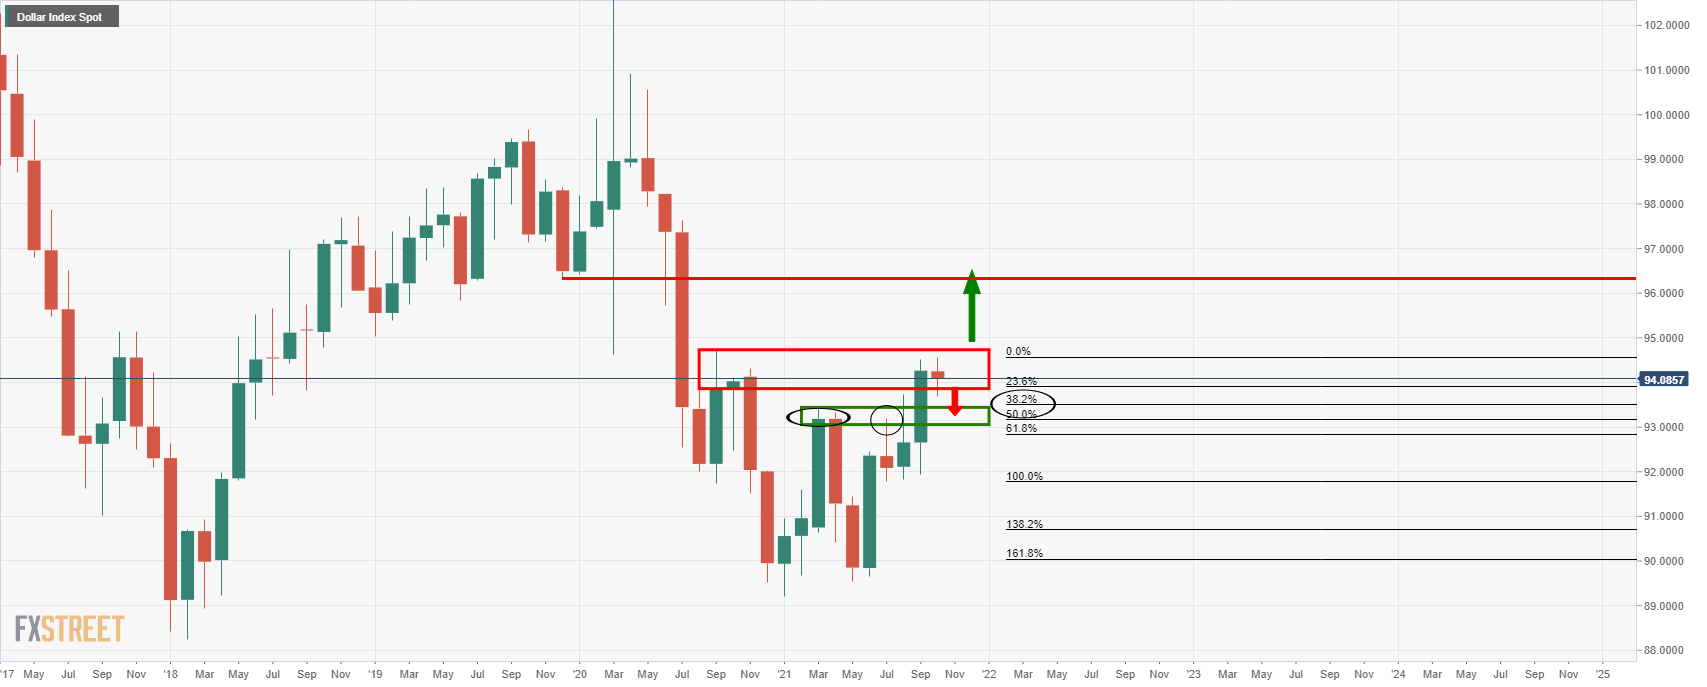
At this juncture, the 38.2% and 50% Fibonacci retracements levels align with the old market structure between March and August 2021 between 93.18 and 93.50.
Gold's fat right tail
Meanwhile, a fundamental and strongly bullish case for gold has been made today by analysts at TD Securities as follows:
Although stagflation has captured share of mind, it has yet to translate into additional gold demand. However, as the global energy crisis intensifies, reasons to own the yellow metal are also growing more compelling. A cold winter could send energy prices astronomically higher, asymmetrically fueling stagflationary winds. This translates into a fat right tail in gold prices. With a low bar for short covering, CTA trend follower purchases could be a potential catalyst.
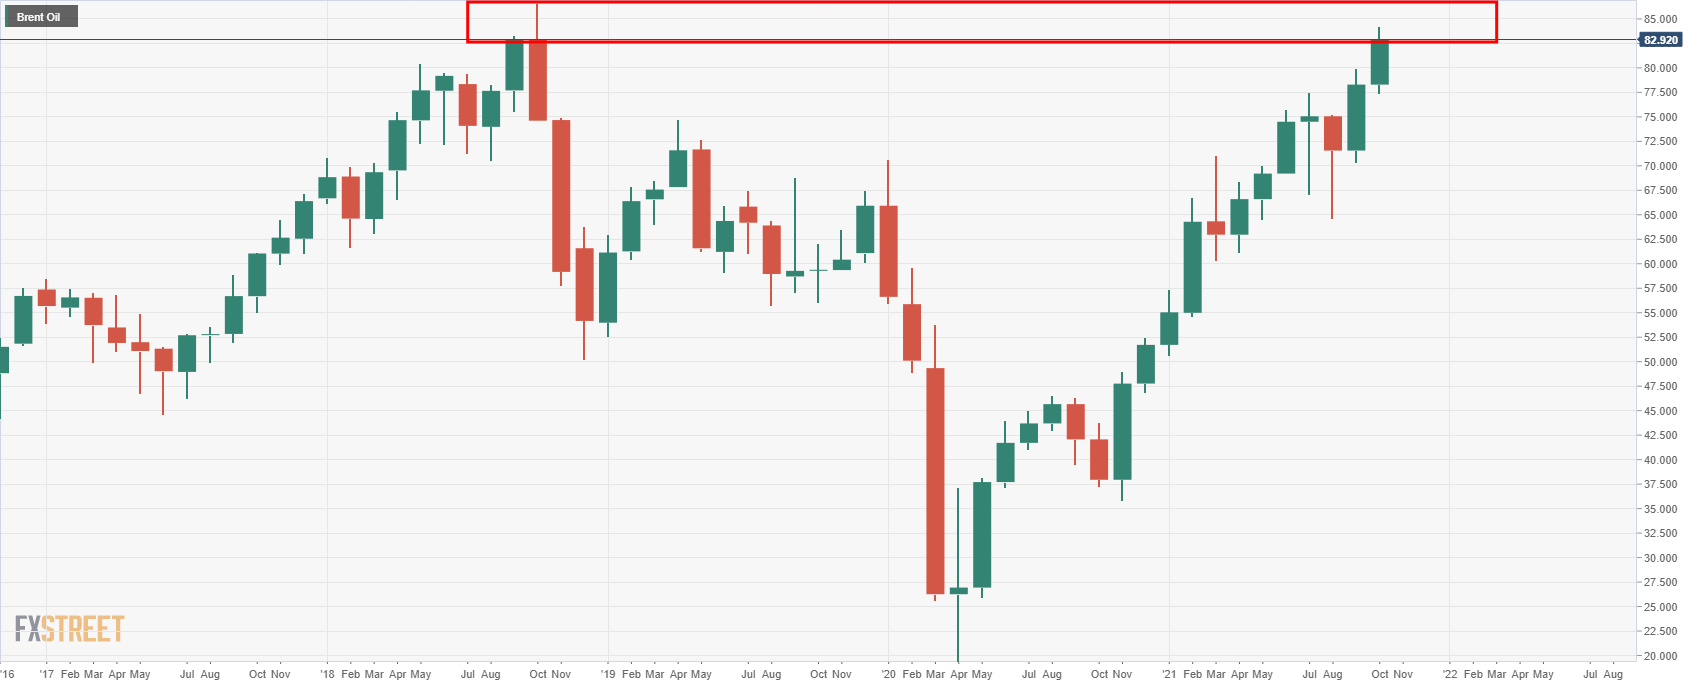
The price of Brent crude, the worlds global benchmark for oil has steadied on the day but remain near to the highest levels since Oct 2018:
Gold technical analysis
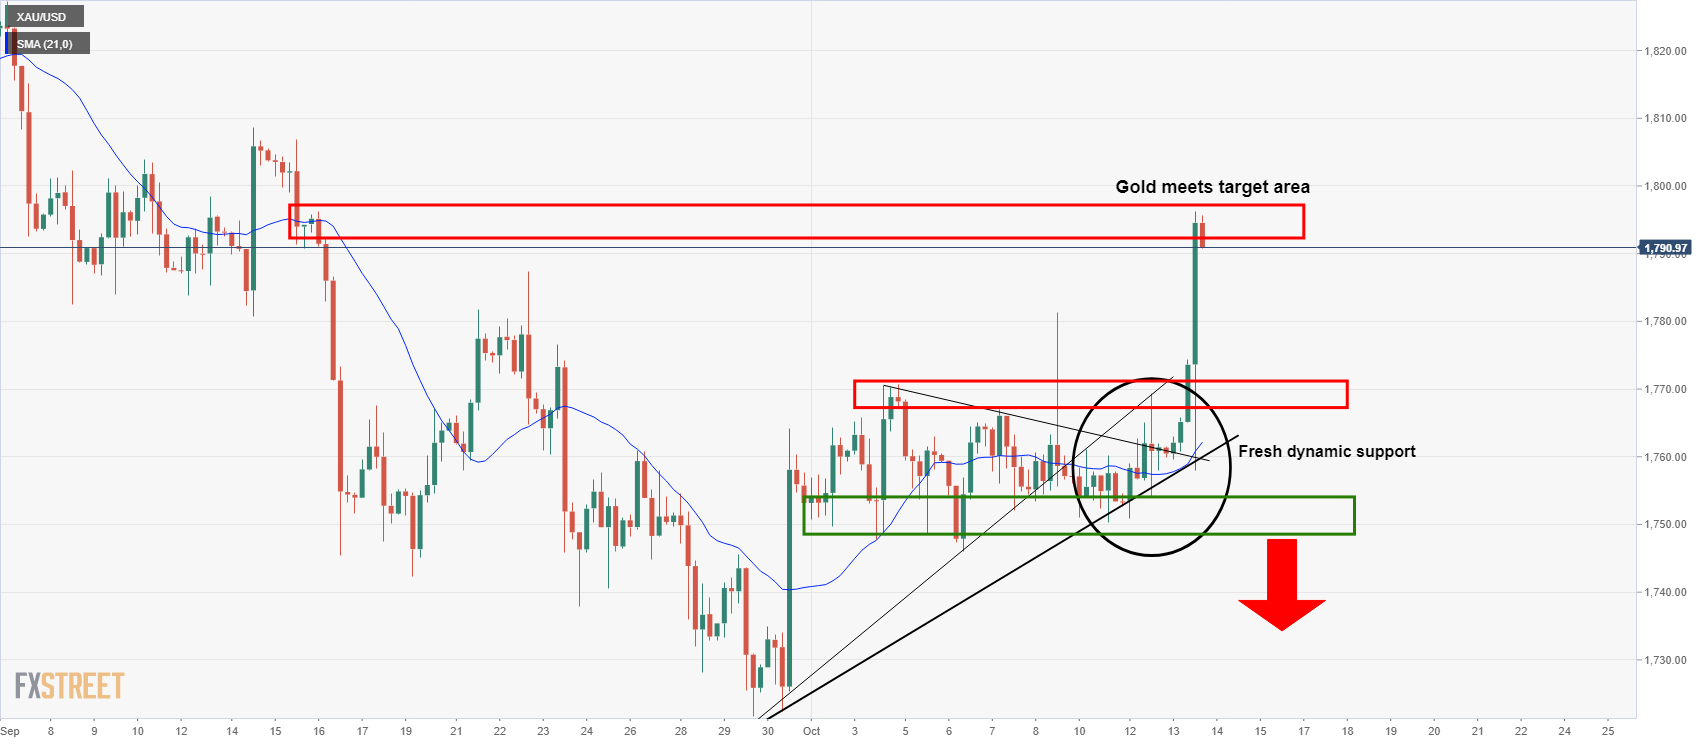
As illustrated on the chart above in analysis at the Asian open this week, from a 4-hour perspective, the target area was between 1,790/1,800 which has been met in today's rally.
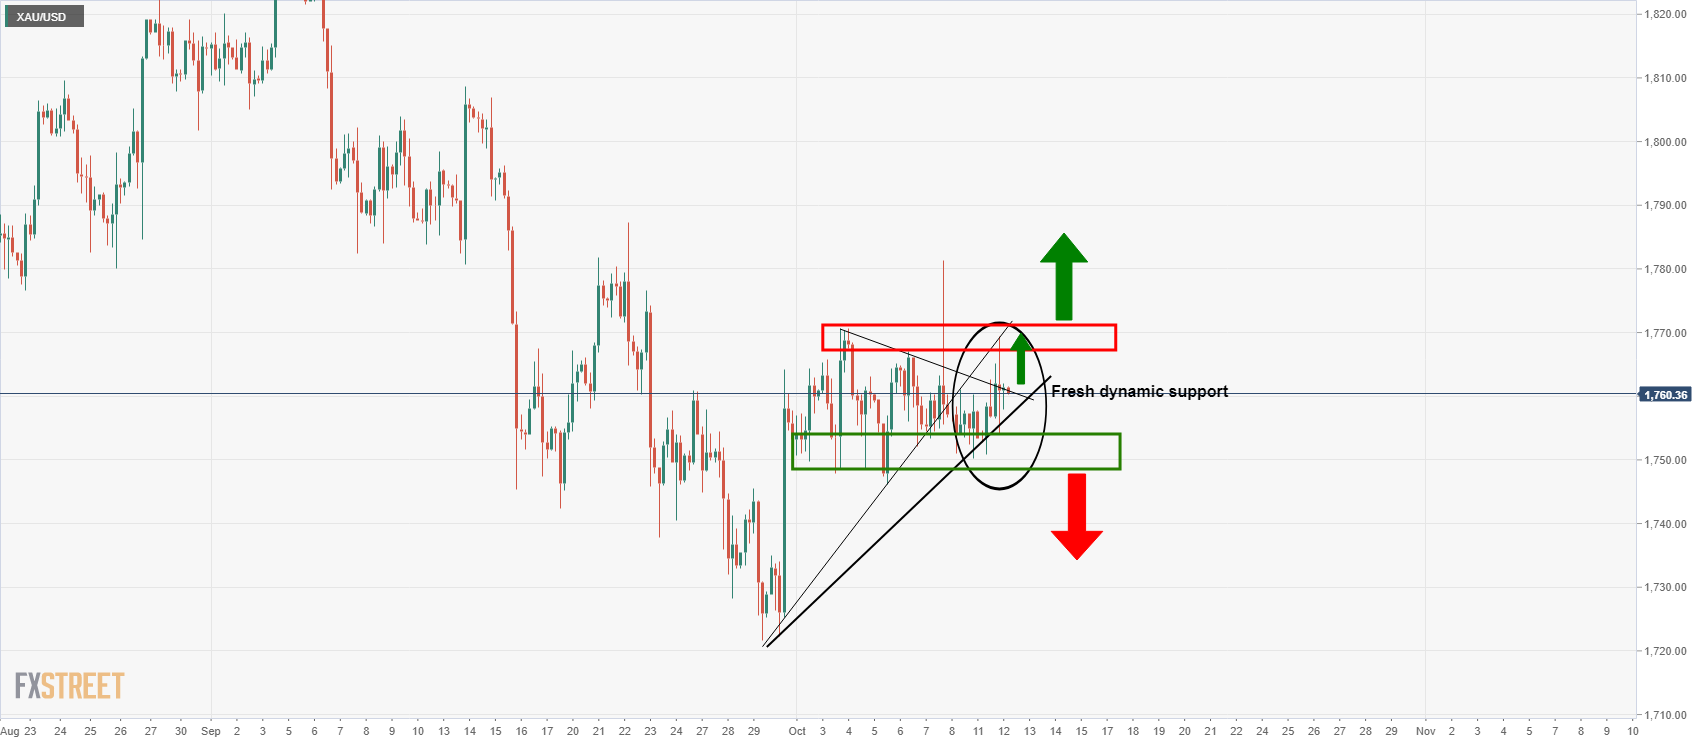
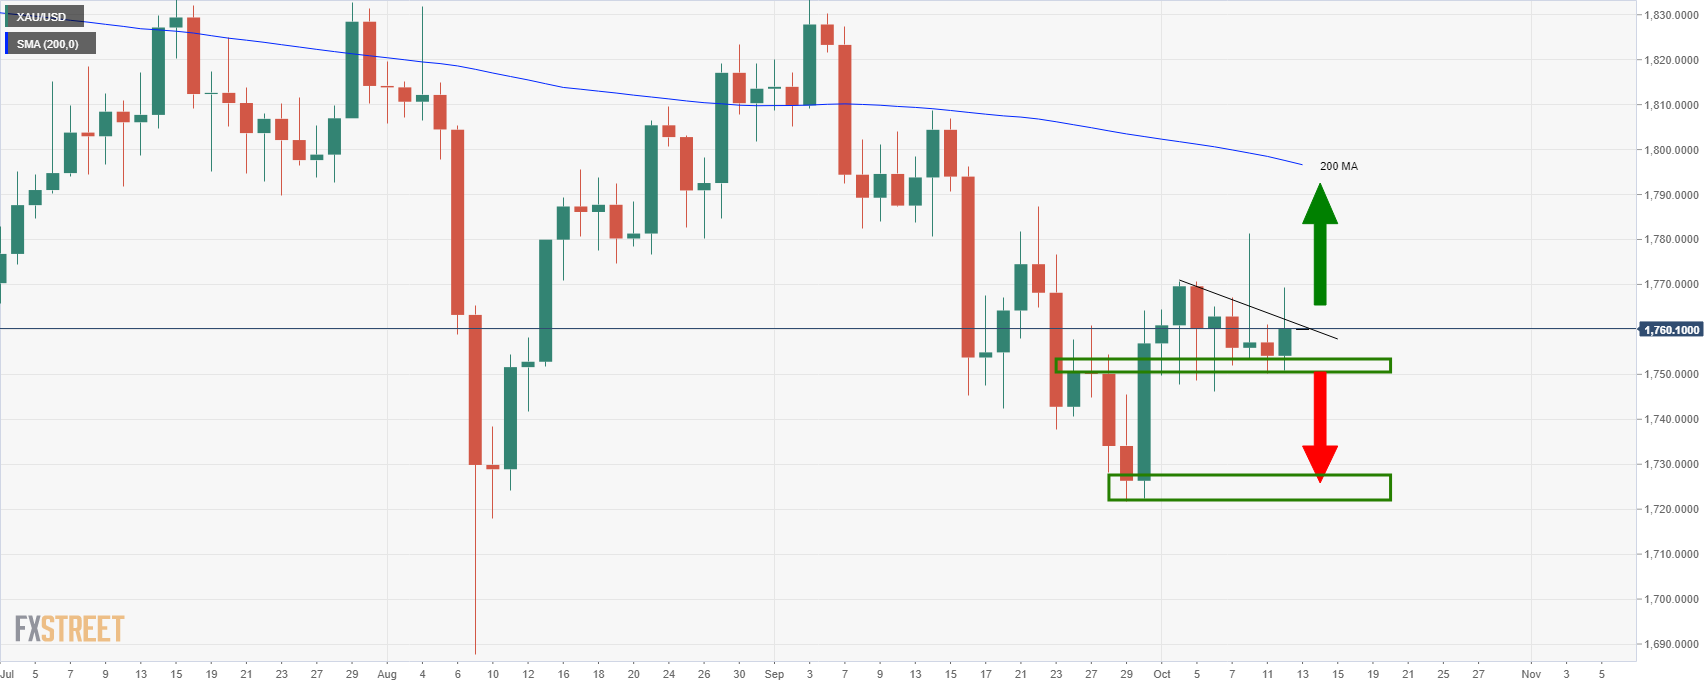
On Tuesday, as the chart below shows, the bears had been testing the grit of the bulls and the price had moved sideways along horizontal support and pushing dynamic support further out along the trend as follows:
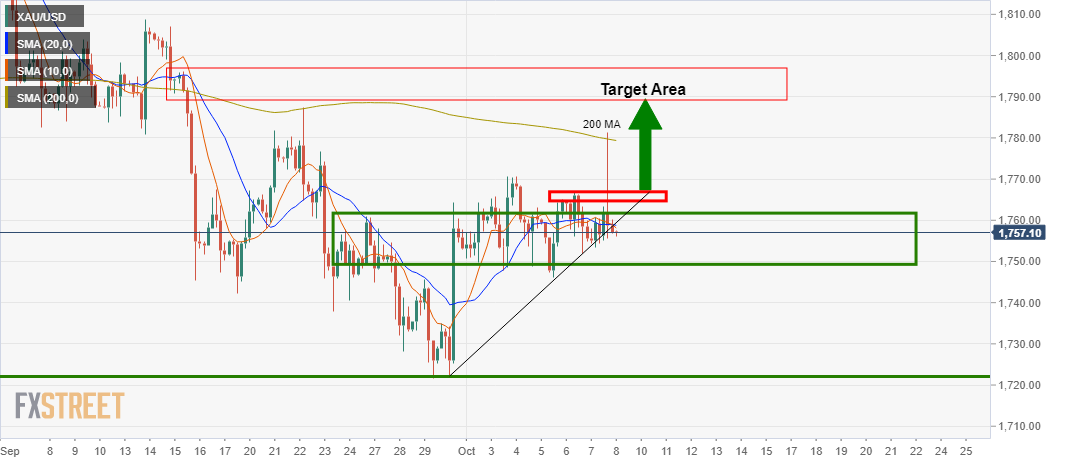
However, the price broke the dynamic resistance which led to the bullish breakout towards the daily 200 MA near 1,800, a move that was illustrated in the daily chart from Tuesday's analysis as follows:
Gold live market, 4-hour chart
Gold live market, daily chart
At this juncture, the price would be expected to stall as traders take profit and assess the landscape of current market themes awaiting the next major catalyst. With that being said, a correction to at least a 38.2% Fibonacci retracement would be expected in the near future. Currently, that level comes in near to $1,780.
Author

Ross J Burland
FXStreet
Ross J Burland, born in England, UK, is a sportsman at heart. He played Rugby and Judo for his county, Kent and the South East of England Rugby team.


