NZD/USD Price Forecast: Bears loom after testing 200-DMA downwards
- NZD/USD drops 0.80% as Middle East tensions boost USD demand.
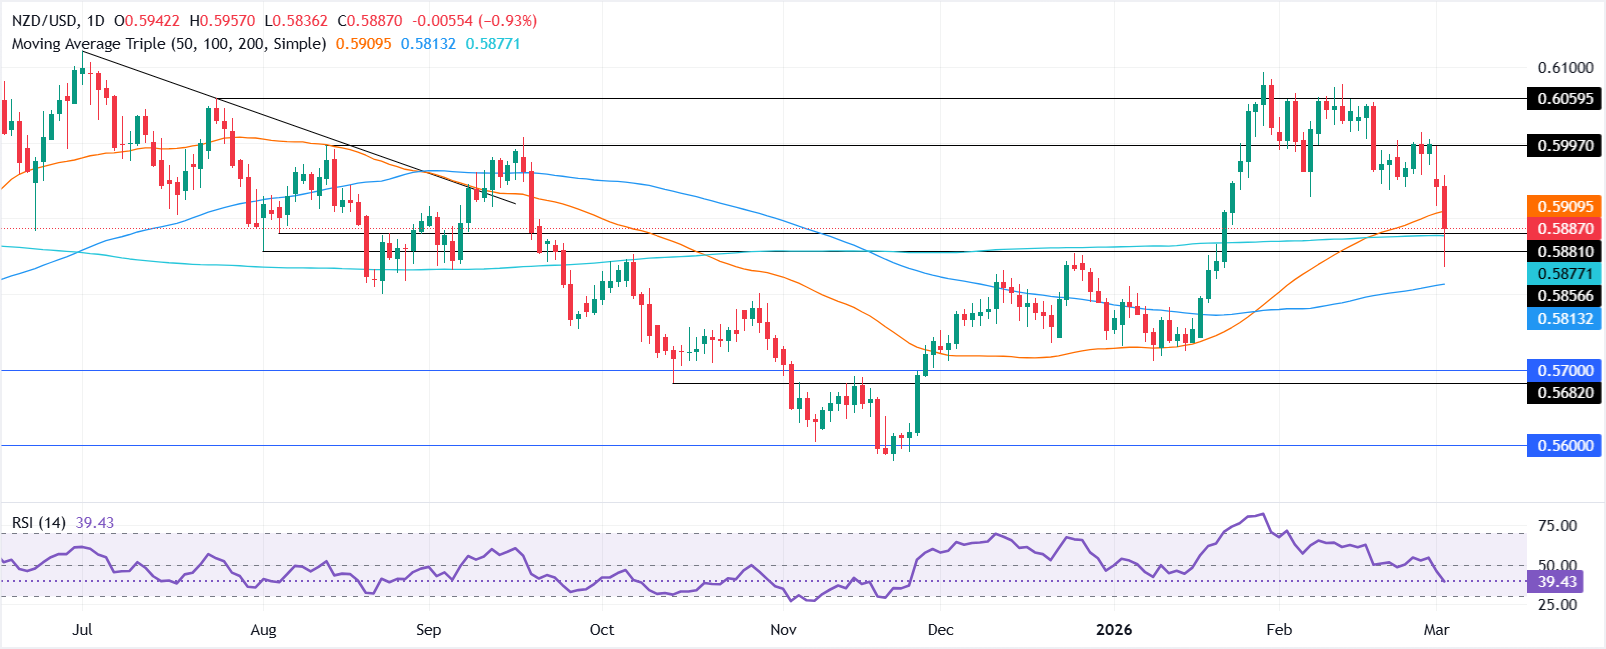
- Break below 0.5874 (200-day SMA) exposes 0.5836 and 0.5813 supports.
- Bulls must reclaim 0.5909 to target 0.5955 and the 0.6000 milestone.
The New Zealand Dollar extends its losses for the second straight day amid a firm US Dollar courtesy of the Middle East conflict, which fueled fears of higher inflation sparked by the jump in Oil prices. The NZD/USD trades at 0.5889, down 0.80%.
NZD/USD Price Forecast: Technical outlook
Kiwi’s technical picture remains upward biased after briefly testing the 200-day Simple Moving Average (SMA) at around 0.5874, climbing above the latter and finishing the session closer to the 0.5900 figure.
Momentum is bearish biased as depicted by the Relative Strength Index (RSI), which is below its 50-neutral level, aiming towards oversold territory.
Hence, the NZD/USD could extend its losses in the short term if sellers clear the 200-day SMA at 0.5874. Once surpassed, the next area of interest would be the day’s low of 0.5836 ahead of the 100-day SMA at 0.5813. A breach of the latter will expose the January 19 low of 0.5737.
For a bullish resumption, traders must clear key resistance levels like the 50-day SMA at 0.5909. After this, watch the March 3 daily peak at 0.5955 for the next area of supply ahead of 0.6000.
NZD/USD Price Chart – Daily
New Zealand Dollar Price This week
The table below shows the percentage change of New Zealand Dollar (NZD) against listed major currencies this week. New Zealand Dollar was the strongest against the Swiss Franc.
| USD | EUR | GBP | JPY | CAD | AUD | NZD | CHF | |
|---|---|---|---|---|---|---|---|---|
| USD | 1.32% | 0.49% | 0.94% | 0.24% | 0.29% | 1.13% | 1.89% | |
| EUR | -1.32% | -0.83% | -0.31% | -1.07% | -1.01% | -0.18% | 0.57% | |
| GBP | -0.49% | 0.83% | 0.34% | -0.26% | -0.19% | 0.64% | 1.43% | |
| JPY | -0.94% | 0.31% | -0.34% | -0.72% | -0.69% | 0.19% | 0.87% | |
| CAD | -0.24% | 1.07% | 0.26% | 0.72% | 0.00% | 0.92% | 1.67% | |
| AUD | -0.29% | 1.01% | 0.19% | 0.69% | -0.01% | 0.82% | 1.60% | |
| NZD | -1.13% | 0.18% | -0.64% | -0.19% | -0.92% | -0.82% | 0.79% | |
| CHF | -1.89% | -0.57% | -1.43% | -0.87% | -1.67% | -1.60% | -0.79% |
The heat map shows percentage changes of major currencies against each other. The base currency is picked from the left column, while the quote currency is picked from the top row. For example, if you pick the New Zealand Dollar from the left column and move along the horizontal line to the US Dollar, the percentage change displayed in the box will represent NZD (base)/USD (quote).
Author

Christian Borjon Valencia
FXStreet
Markets analyst, news editor, and trading instructor with over 14 years of experience across FX, commodities, US equity indices, and global macro markets.