Gold Price Forecast: XAU/USD remains sideways below $1,740
- Gold attempts a bounce but not out of the woods yet.
- Firmer DXY, yields could cap gold’s rebound amid US infrastructure bill vote.
- Gold Weekly Forecast: Eyes $1,750 on NFP-inspired USD strength

Update: Gold prices swing in a very narrow trading range between $1,730 and $1,735 on Tuesday. Prices continue to grind lower but manage to recover from the extremely low levels. The major downfall on Monday was the after-effects of Friday’s jobs report which came well above the market estimates of 845K to the actual 943K jobs were added to the US economy. The unemployment rate forecast too moved from 5.7% to 5.5% with the actual reading came at 5.4%. The readings hinted at a rapid economic recovery, which fueled the expectation of a sooner-than-expected rate hike by the US Federal Reserve. The higher interest rates imply an inverse relationship with the gold prices. The downside is capped amid worries over the repaid spread of the Delta strain as investors remained pessimistic on the risker assets. The higher USD valuations remained a negative factor for the dollar-denominated precious metal prices.
Gold is turning positive for the first time in four days, consolidating the previous recovery from five-month lows of $1688. The bears take a breather, allowing a tepid bounce above the $1700 mark. Gold price could be drawing some support from the US $1 trillion infrastructure bill, which is scheduled for a Senate vote later on Tuesday. However, the further upside appears elusive, as the Fed’s tapering expectations continue to buoy the US dollar alongside the Treasury yields. July’s NFP report and upbeat Fedspeak have brought forward hawkish bets on the Fed’s policy stance. Gold traders now await the US CPI report due later this week for fresh trading directives on the metal.
Read: Gold: Levels, ranges and targets
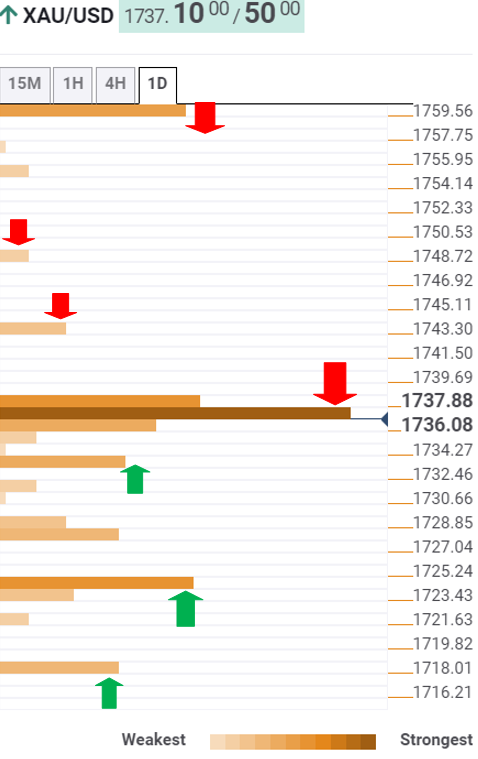
Gold Price: Key levels to watch
The Technical Confluences Detector shows that gold is challenging critical resistance level around $1737, the convergence of the SMA5 four-hour, pivot point one-month S2, pivot point one-week S1 and Fibonacci 61.8% one-day.
On rejection at the latter, sellers could return, looking for a target at the previous high four-hour at $1733.
If the downside pressure intensifies, then a test of the Fibonacci 161.8% one-month at $1725 will be inevitable.
Further south, the Fibonacci 38.2% one-day at $1718 will be threatened.
On the upside, acceptance above the $1737 key cap is critical to extending the recovery momentum towards the SMA10 four-hour at $1743.
Bulls will then challenge the Bollinger Band one-hour Upper at $1748, above which doors will open up towards $1759, the previous week’s low.
Here is how it looks on the tool
About Technical Confluences Detector
The TCD (Technical Confluences Detector) is a tool to locate and point out those price levels where there is a congestion of indicators, moving averages, Fibonacci levels, Pivot Points, etc. If you are a short-term trader, you will find entry points for counter-trend strategies and hunt a few points at a time. If you are a medium-to-long-term trader, this tool will allow you to know in advance the price levels where a medium-to-long-term trend may stop and rest, where to unwind positions, or where to increase your position size.
Author

Dhwani Mehta
FXStreet
Residing in Mumbai (India), Dhwani is a Senior Analyst and Manager of the Asian session at FXStreet. She has over 10 years of experience in analyzing and covering the global financial markets, with specialization in Forex and commodities markets.


