Gold Price Forecast: XAU/USD’s path of least resistance is down, levels to watch – Confluence Detector
- Gold price corrects from four-week lows but downside bias remains intact.
- Hawkish Powell, Omicron covid fears take bond and gold markets on a spin.
- Gold looks to extend rebound amid renewed coronavirus fears.

Gold price stays volatile so far this week, with the risks skewed to the downside, as the bright metal remains at the mercy of the Omicron covid variant fears and Fed sentiment. Fed Chair Jerome Powell’s hawkish surprise and the new variant updates triggered massive bond market volatility, impacting the dollar valuations alongside gold price.
All eyes now remain on the US ADP and ISM Manufacturing PMI for fresh trading impulse, as day 2 of Powell’s testimony may unlikely have any market-moving impact.
Read: Gold Price Forecast: XAU/USD not out of the woods yet, November lows still in sight
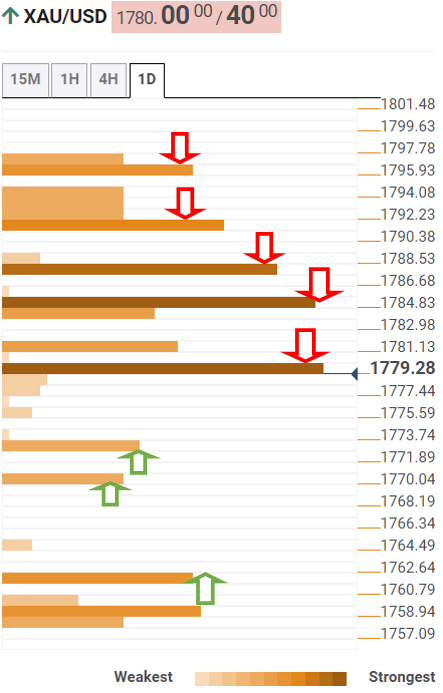
Gold Price: Key levels to watch
The Technical Confluences Detector shows that the gold price is battling strong resistance at $1,780, which is the convergence of the previous week’s low and Fibonacci 23.6% one-day.
Gold price will then extend its recovery towards the next relevant resistance aligned at $1,785, the confluence of the Fibonacci 38.2% one-day, SMA5 one-day and SMA10 four-hour.
The Fibonacci 23.6% one-month at $1,788 will test the recovery momentum, as the bulls will then battle a dense cluster around $1,793.
The SMA50, 100 and 200 one-day coincide with the Fibonacci 61.8% one-day at that level, forming it a crucial upside barrier for gold buyers.
Offers around $1,799-$1,800 will then be probed, where Monday’s high and Fibonacci 23.6% one-month meet.
On the flip side, gold bulls will receive some temporary reprieve at the previous low four-hour of $1772, below which the previous day’s low at $1,770 will get retested.
A sustained break below the latter will fuel a sharp drop towards the pivot point one-week S1 at $1,760, near where the November lows lie.
Here is how it looks on the tool
About Technical Confluences Detector
The TCD (Technical Confluences Detector) is a tool to locate and point out those price levels where there is a congestion of indicators, moving averages, Fibonacci levels, Pivot Points, etc. If you are a short-term trader, you will find entry points for counter-trend strategies and hunt a few points at a time. If you are a medium-to-long-term trader, this tool will allow you to know in advance the price levels where a medium-to-long-term trend may stop and rest, where to unwind positions, or where to increase your position size.
Author

Dhwani Mehta
FXStreet
Residing in Mumbai (India), Dhwani is a Senior Analyst and Manager of the Asian session at FXStreet. She has over 10 years of experience in analyzing and covering the global financial markets, with specialization in Forex and commodities markets.


