Gold Price Forecast: XAU/USD trades lower around $3,325 amid risk-on market sentiment
- Gold price falls to near $3,325 as the market sentiment remains broadly stable.
- Trump signs orders that Washington will start charging additional duties from August 1.
- Washington imposes 25% tariffs on imports from Japan and South Korea.

Gold price (XAU/USD) drops to near $3,325 during the European trading session on Tuesday. The yellow metal faces slight selling pressure as the market sentiment is favorable for risky assets, following the grace period from United States (US) President Donald Trump to allow trading partners to strike a trade deal.
On Monday, US President Trump signed executive orders that allows Washington to charge new tariffs on imports from August 1, instead of July 9 announced previously. Although Trump has not claimed it as a grace period for 90-day tariff pause to allow nations to negotiate on import duty rates, it buys time for countries to schedule trade talks with US negotiators.
The demand for safe-haven assets, such as Gold, diminished in a cheerful marked mood.
Additionally, stable US Dollar (USD) has also capped the Gold price’s upside. The US Dollar Index (DXY), which tracks the Greenback’s value against six major currencies, regains ground after a slight correction to near 97.35 from the fresh weekly high of 97.66 posted on Monday.
Meanwhile, the announcement of new tariff rates by US Trump for 14 countries, notably Japan and South Korea on which 25% levy has been imposed has raised uncertainty over the US trade policy. Given that Japan is one of the leading trading partners of the US, trade tensions between them propel global trade worries. Such a scenario is favorable for safe-haven assets, such as Gold.
Going forward, investors will focus on the release of the Federal Open Market Committee (FOMC) minutes of the June 17-18 policy meeting, which will be published on Wednesday.
Gold technical analysis
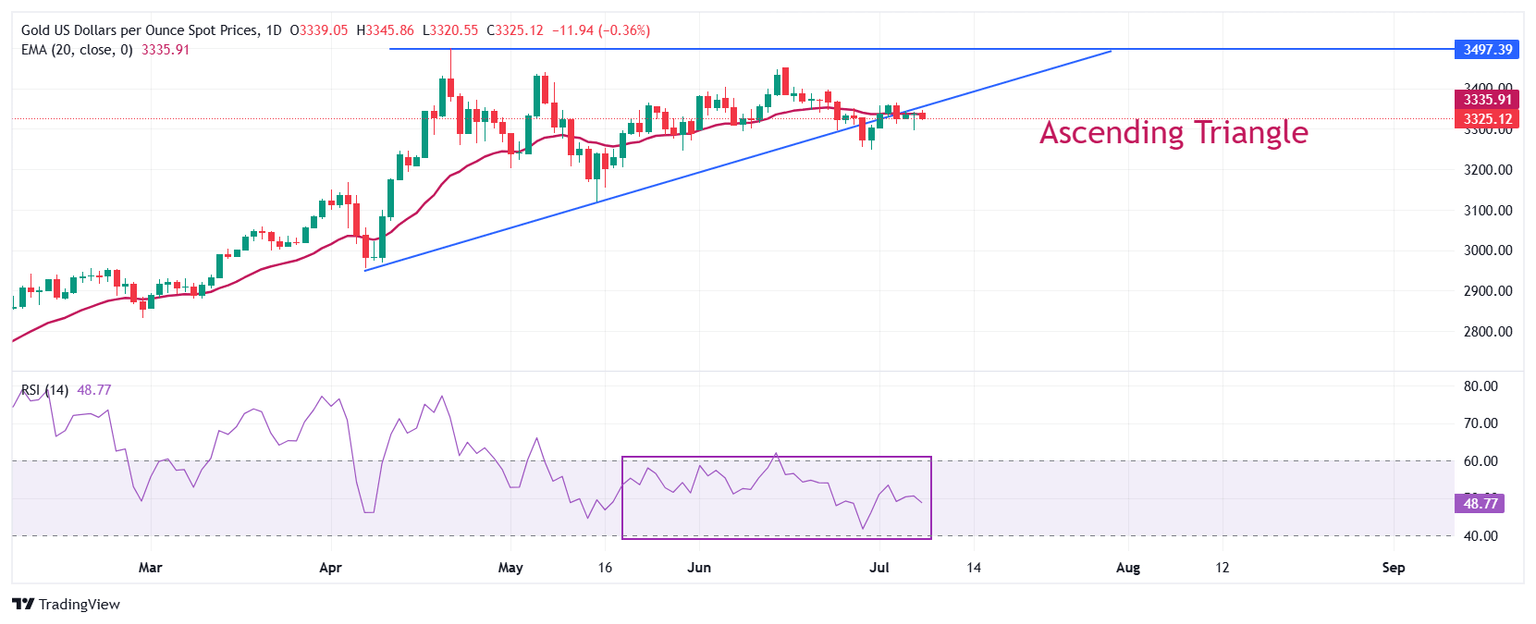
Gold price trades close to the upward-sloping trendline of an Ascending Triangle formation on a daily timeframe, which is placed from the April 7 low of $2,957. The horizontal resistance of the above-mentioned chart pattern is plotted from the April 22 high around $3,500. Theoretically, a breakdown of the asset below the upward-sloping trendline results in a sharp downfall.
The precious metal trades below the 20-day Exponential Moving Average (EMA) around $3,334, suggesting that the near-term trend is uncertain.
The 14-day Relative Strength Index (RSI) oscillates inside the 40.00-60.00 range, indicating a sideways trend.
Looking up, the Gold price would enter in an unchartered territory after breaking above the psychological level of $3,500 decisively. Potential resistances would be $3,550 and $3,600.
Alternatively, a downside move by the Gold price below the May 29 low of $3,245 would drag it towards the round-level support of $3,200, followed by the May 15 low at $3,121.
Gold daily chart
Gold FAQs
Gold has played a key role in human’s history as it has been widely used as a store of value and medium of exchange. Currently, apart from its shine and usage for jewelry, the precious metal is widely seen as a safe-haven asset, meaning that it is considered a good investment during turbulent times. Gold is also widely seen as a hedge against inflation and against depreciating currencies as it doesn’t rely on any specific issuer or government.
Central banks are the biggest Gold holders. In their aim to support their currencies in turbulent times, central banks tend to diversify their reserves and buy Gold to improve the perceived strength of the economy and the currency. High Gold reserves can be a source of trust for a country’s solvency. Central banks added 1,136 tonnes of Gold worth around $70 billion to their reserves in 2022, according to data from the World Gold Council. This is the highest yearly purchase since records began. Central banks from emerging economies such as China, India and Turkey are quickly increasing their Gold reserves.
Gold has an inverse correlation with the US Dollar and US Treasuries, which are both major reserve and safe-haven assets. When the Dollar depreciates, Gold tends to rise, enabling investors and central banks to diversify their assets in turbulent times. Gold is also inversely correlated with risk assets. A rally in the stock market tends to weaken Gold price, while sell-offs in riskier markets tend to favor the precious metal.
The price can move due to a wide range of factors. Geopolitical instability or fears of a deep recession can quickly make Gold price escalate due to its safe-haven status. As a yield-less asset, Gold tends to rise with lower interest rates, while higher cost of money usually weighs down on the yellow metal. Still, most moves depend on how the US Dollar (USD) behaves as the asset is priced in dollars (XAU/USD). A strong Dollar tends to keep the price of Gold controlled, whereas a weaker Dollar is likely to push Gold prices up.
Author

Sagar Dua
FXStreet
Sagar Dua is associated with the financial markets from his college days. Along with pursuing post-graduation in Commerce in 2014, he started his markets training with chart analysis.


