Gold Price Forecast: XAU/USD steadies above $1,700, falling wedge, energy crisis in focus
- Gold price struggles to justify falling wedge breakout as US holiday limits trading moves.
- DXY jumps to fresh high in 20 years before trading sideways.
- EU’s energy crisis, Sino-American tussles join softer China data to weigh on prices.
- Mixed US jobs report triggered corrective bounce, central bankers are in focus ahead.

Gold price (XAU/USD) treads water at around $1,710 during Monday’s Asian session as the US holiday challenges momentum traders. In doing so, the bright metal ignores the firmer US Dollar, as well as challenges to the risk appetite.
That said, the US Dollar Index (DXY) prints mild gains as it seesaws around 110.00 after rising to the fresh high since 2002 during the early Asian session. The underlying reason should be the weekend headlines surrounding the escalating energy crisis in Europe, as well as the US-China tension.
On late Friday, the Group of Seven (G7) nations agreed on capping the price of Russian oil in the international markets. Following that, Moscow halted energy supplies to the European Union (EU) through Nord Stream 1 pipeline, citing a ‘leak’, during the weekend. It’s worth noting, however, that Politico ran a story mentioning that Russia’s Gazprom said on Saturday it would increase its shipments of gas to Europe via Ukraine, citing media reports. In addition to the Russia-linked energy problems and a likely recession due to the same, a halt in the US-Iran nuclear talks also amplifies oil woes for the old continent, as well as for the globe. “Iran nuclear talks stall again after latest response from Tehran,” said Bloomberg.
On a different page, US President Joe Biden’s administration poured cold water on the face of expectations that the US may ease/remove the Trump-era tariffs on China. “The Biden administration will allow Trump-era tariffs on hundreds of billions of dollars of Chinese merchandise imports to continue while it reviews the need for the duties,” said Bloomberg.
It’s worth noting that the greenback’s gauge versus the six major currencies, namely the DXY, eased late Friday after the US employment data flashed mixed numbers for August.
US employment data marked mixed readings as the headline Nonfarm Payrolls (NFP) rose past 300K forecast to 315K, versus 526K prior, but the Unemployment Rate rose to 3.7% compared to 3.5% expected and prior. Further details reveal that the Average Hourly Earnings reprinted 5.2% growth for August, a bit lesser than the 5.3% market consensus. Also, Factory Orders dropped to -1.0% for July compared to 0.2% forecasts and 1.8% in previous readings.
Amid these plays, S&P 500 Futures print mild gains while the US holiday limits the moves of the US Treasury yields.
Moving on, the US holiday could restrict XAU/USD moves but challenges to the risk appetite may test the buyers.
Technical analysis
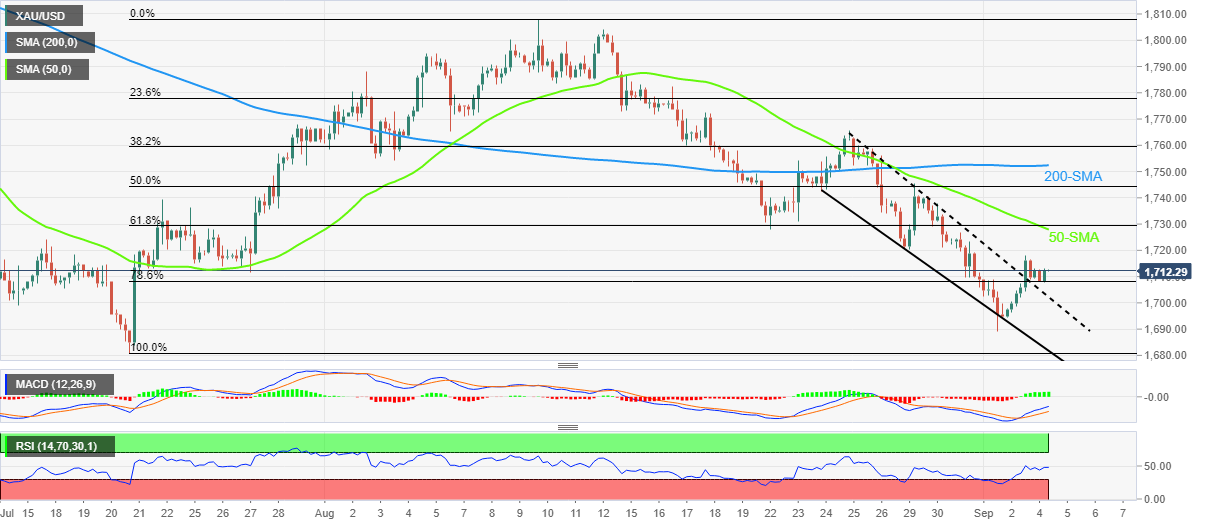
A clear breakout of the eight-day-old falling wedge joins firmer RSI and bullish MACD signals to keep gold buyers hopeful. That said, a convergence of the 50-SMA and 61.8% Fibonacci retracement level of July-August upside, near $1,729, appears immediate hurdle for the XAU/USD bulls to watch.
Following that, the 200-SMA and the late August swing high, respectively near $1,753 and $1,766 in that order, will be important for the bullion traders to aim.
It should be noted that the falling wedge confirmation signals the theoretical target of $1,778.
Meanwhile, pullback moves remain harmless until staying beyond the stated wedge’s resistance line, now support around the $1,700 round figure.
Should the metal price fails to rebound from the $1,700 support, the yearly low marked in July at around $1,680 will be eyed by the bears.
Gold: Four-hour chart
Trend: Further recovery expected
Author

Anil Panchal
FXStreet
Anil Panchal has nearly 15 years of experience in tracking financial markets. With a keen interest in macroeconomics, Anil aptly tracks global news/updates and stays well-informed about the global financial moves and their implications.


