Gold Price Forecast: XAU/USD stays defensive above $1,800 ahead of United States Nonfarm Payrolls
- Gold price seesaws around the key Fibonacci retracement level after Wednesday’s sluggish performance.
- Market players take a breather amid absence of any major surprise.
- United States Treasury bond yield curve inversion, hawkish Federal Reserve bias keep XAU/USD bears hopeful.
- US employment report for February is the key catalyst for Gold price, Nonfarm Payrolls gain major attention.

Gold price (XAU/USD) stretches Wednesday’s boring moves around $1,815 as it seeks more clues during early Thursday, amid a firmer bearish bias due to the hawkish Federal Reserve (Fed) concerns and recession woes.
That said, the yellow metal’s latest inaction could be linked to an absence of major surprise from the market, as well as a cautious mood ahead of Friday’s key United States employment report for February. However, the widest yield curve inversion since 1981 joins the hawkish rhetoric from Fed Chair Jerome Powell to keep the XAU/USD bears hopeful.
Gold price stays dicey on Federal Reserve Chairman Powell’s repetitive remarks
Despite refreshing a one-week low, the Gold price failed to portray any major moves on Wednesday as Federal Reserve Chairman Jerome Powell repeated his hawkish remarks in front of the House Financial Service Committee. The policymaker highlighted the data dependency of the Fed while also signaling that they have underestimated the resilience of growth and inflation. The news defends the hawkish Fed bias as market players expected a 50 bps rate hike in March, versus 0.25% expected in the last week. With this, the XAU/USD remains depressed near the key Fibonacci retracement level.
United States data, Treasury bond yields favor XAU/USD bears
Although repeated comments from Fed’s Powell allowed Gold traders to catch a breather on Wednesday after the volatile Tuesday, upbeat United States data and strong Treasury bond yields exert downside pressure on the XAU/USD price.
On Wednesday, the US ADP Employment Change rose to 242K in February versus 200K market forecasts and 119K prior (revised). Further, the US Goods and Services Trade Balance dropped to $-68.3B from the $-67.2B previous reading (revised) and $-68.9B analysts’ estimations. It should be noted that the US JOLTS Job Openings for January improved to 10.824M versus 10.6M expected but eased from 11.234M revised prior.
It should be noted that the benchmark US Treasury bond yields rose in the last three consecutive days and raised recession fears via the widest difference between the two-year and 10-year bond coupons.
Elsewhere, the US removed testing restrictions on travelers from China and joined a light calendar to allow the traders to lick their wounds after a volatile Tuesday.
Amid these plays, Wall Street closed mixed and the S&P 500 Futures also remains sidelined after a dicey day.
Moving on, China’s China’s monthly Consumer Price Index (CPI) and the Producer Price Index (PPI) for February could direct immediate Gold price moves ahead of the United States employment report, up for publishing on Friday.
Also read: Gold Price Forecast: Bulls losing the battle, $1,800 at sight
Gold price technical analysis
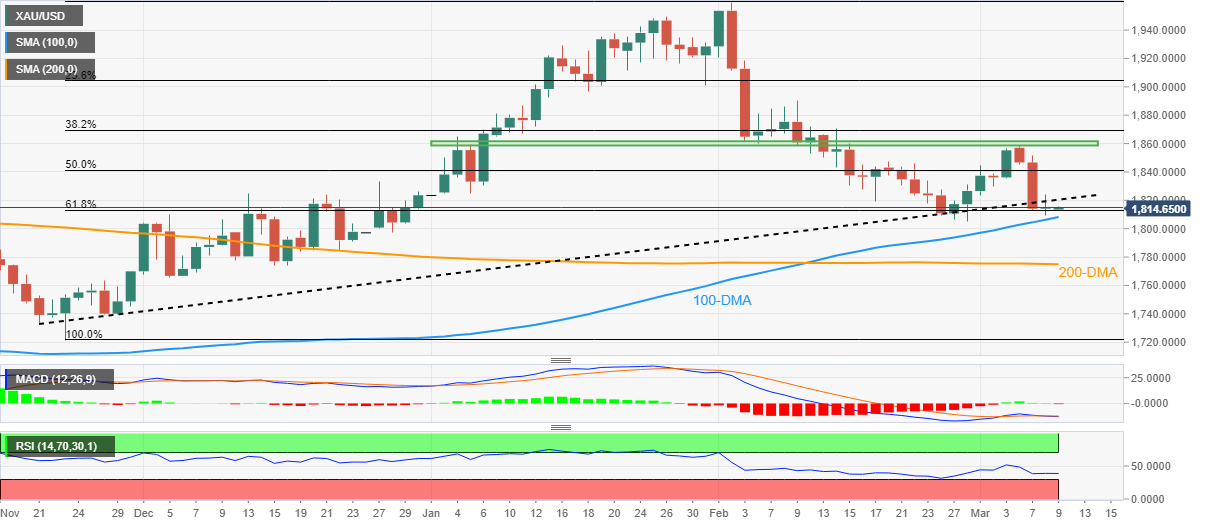
Gold price seesaws around the 61.8% Fibonacci retracement of its late November 2022 to the early last month’s run-up as bears await the key United States data to extend the weekly fall.
However, a clear downside break of the 3.5-month-old ascending trend line joins the impending bear cross on the Moving Average Convergence and Divergence (MACD) indicator to keep the XAU/USD sellers hopeful.
It should be noted that the 100-DMA, around $1,805 by the press time, acts as an immediate downside support for the Gold price, a break of which could quickly fetch the XAU/USD toward testing the 200-DMA support of $1,775. That said, the $1,800 threshold may act as an intermediate halt during the anticipated fall.
Meanwhile, the corrective bounce needs to cross the previous support line from late November 2022, now resistance around $1,820.
Even so, the 50% Fibonacci retracement level and a two-month-long horizontal area, respectively near $1,840 and $1,858-62, could challenge the Gold buyers before giving them control.
It’s worth mentioning that the nearly oversold condition of the Relative Strength Index (RSI), placed at 14, suggests limited downside room for the metal.
Gold price: Daily chart
Trend: Further downside expected
Author

Anil Panchal
FXStreet
Anil Panchal has nearly 15 years of experience in tracking financial markets. With a keen interest in macroeconomics, Anil aptly tracks global news/updates and stays well-informed about the global financial moves and their implications.


