Gold Price Forecast: XAU/USD stays bearish below $1,925, US data, Fed Minutes eyed – Confluence Detector
- Gold Price portrays pre-data anxiety amid US Dollar’s retreat.
- Mixed data from China, PBoC rate cut also allows the XAU/USD to lick its wounds.
- Gold price struggles below $1,925 resistance confluence but sellers remain cautious beyond $1,888.
- US Retail Sales, FOMC Minutes eyed for clear directions, risk catalysts eyed as well.

Gold Price (XAU/USD) cheers a pullback in the US Dollar, as well as mixed the market’s consolidation ahead of the top-tier US data/events to portray a corrective bounce off a five-week low. Adding strength to the XAU/USD’s rebound could be the People’s Bank of China’s (PBoC) rate cut and a slew of downbeat China data suggesting more stimulus from the Dragon Nation. Above all, a retreat of the US Dollar Index (DXY) joins the sluggish Treasury bond yields and cautious optimism in the market to allow the Gold bears to take a breather.
Looking ahead, the US Retail Sales for July, expected 0.4% MoM versus 0.2% prior, will be important to watch for intermediate directions of the Gold Price ahead of Wednesday’s Minutes of the Federal Reserve’s (Fed) latest monetary policy meeting. Above all, the bond market moves will be crucial for a clear guide.
Also read: Gold Price Forecast: XAU/USD hangs near multi-week low, just above $1,900 mark
Gold Price: Key levels to watch
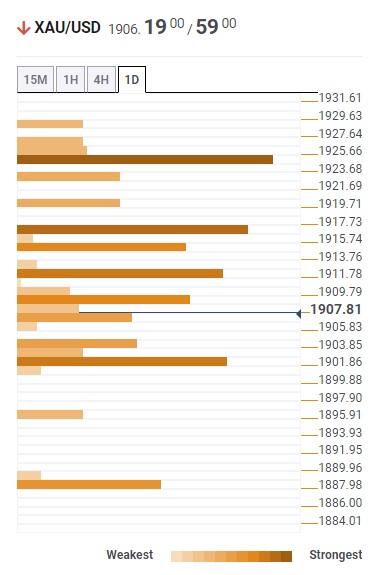
As per our Technical Confluence indicator, the Gold Price stays well beneath the key $1,925 resistance confluence comprising the 50-SMA on the four-hour (4H) formation, Fibonacci 38.2% on one-week and 161.8% on one-day.
Also keeping the XAU/USD bears hopeful is the quote’s clear downside break of the $1,918 support encompassing Pivot Point one-month S1, previous daily high and 100-HMA.
It’s worth noting that a convergence of the previous weekly low and the Fibonacci 61.8% on one-day, also known as the Golden Fibonacci Ratio, restricts the XAU/USD’s immediate upside near $1,912.
With this, the Gold Price appears well set to drop toward the previous monthly low of around $1,901 encompassing the Pivot Point one-week S1 and one-day S1, as well as the lower band of the Bollinger on the one-day.
However, the quote’s weakness past $1,901 has a space to fill unless hitting the yearly low marked in June around $1,893. Following that, Pivot point one-day S3 and one-week S2, near $1,888, will act as the last defense of the Gold bears.
Meanwhile, a clear upside break of the $1,920 resistance confluence could propel the Gold Price towards the $1,935 level encompassing Pivot Point one-week R1 and Fibonacci 61.8% on one-month.
Here is how it looks on the tool
About Technical Confluences Detector
The TCD (Technical Confluences Detector) is a tool to locate and point out those price levels where there is a congestion of indicators, moving averages, Fibonacci levels, Pivot Points, etc. If you are a short-term trader, you will find entry points for counter-trend strategies and hunt a few points at a time. If you are a medium-to-long-term trader, this tool will allow you to know in advance the price levels where a medium-to-long-term trend may stop and rest, where to unwind positions, or where to increase your position size.
Author

Anil Panchal
FXStreet
Anil Panchal has nearly 15 years of experience in tracking financial markets. With a keen interest in macroeconomics, Anil aptly tracks global news/updates and stays well-informed about the global financial moves and their implications.


