Gold Price Forecast: XAU/USD slumps below $1780, clings to the 50-DMA
- Gold price is falling on high US yields and a risk-on impulse.
- US housing data keeps worsening, adding to Monday’s NY Fed Manufacturing Index, which reignites recession fears.
- Investors are eyeing the FOMC last meeting minutes on Wednesday and further Fed speakers.

Gold price slides due to an uptick in US bond Treasury yields, amidst a mixed market sentiment, with EU and US equities split between gainers and losers as the North American session begins. Meanwhile, mixed US economic data keeps traders assessing the US economic outlook in the near-to-medium term. At the time of writing, XAU/USD is trading at $1776.72 a troy ounce.
XAU/USD slides on high US bond yields amidst mixed US data
Gold is pressured by a slight improvement in sentiment. In the meantime, Industrial Production in the US rose for the first time in three months, 0.6% MoM reading, underpinned by motor vehicles, which benefitted from improvements in chip supplies. Earlier, Building Permits and Housing Starts plunged, each decreasing by -1.3% MoM and -9.6% MoM, respectively, signaling that increases in the Federal funds rate (FFR) are taking their toll on the housing market.
Besides, a dismal reading in Federal Reserve’s Regional Banks, led by the NY Fed Empire State Index, paints a battered picture of an upcoming US recession.
Aside from this, US Treasury yields are rising, led by the short term of the curve, which is a headwind for the yellow metal price. The US 10-year T-bond yield is at 2.851%, up six basis points, erasing Monday’s losses.
Meanwhile, the US Dollar Index, a gauge of the greenback’s value vs. a basket of peers, is almost flat at 106.473.
What to watch
The US economic docket will feature the Federal Reserve Open Market Committee minutes from their last meeting and Fed speakers, led by Kansas City Fed’s Esther George and Minnesota Fed’s Neil Kashkari.
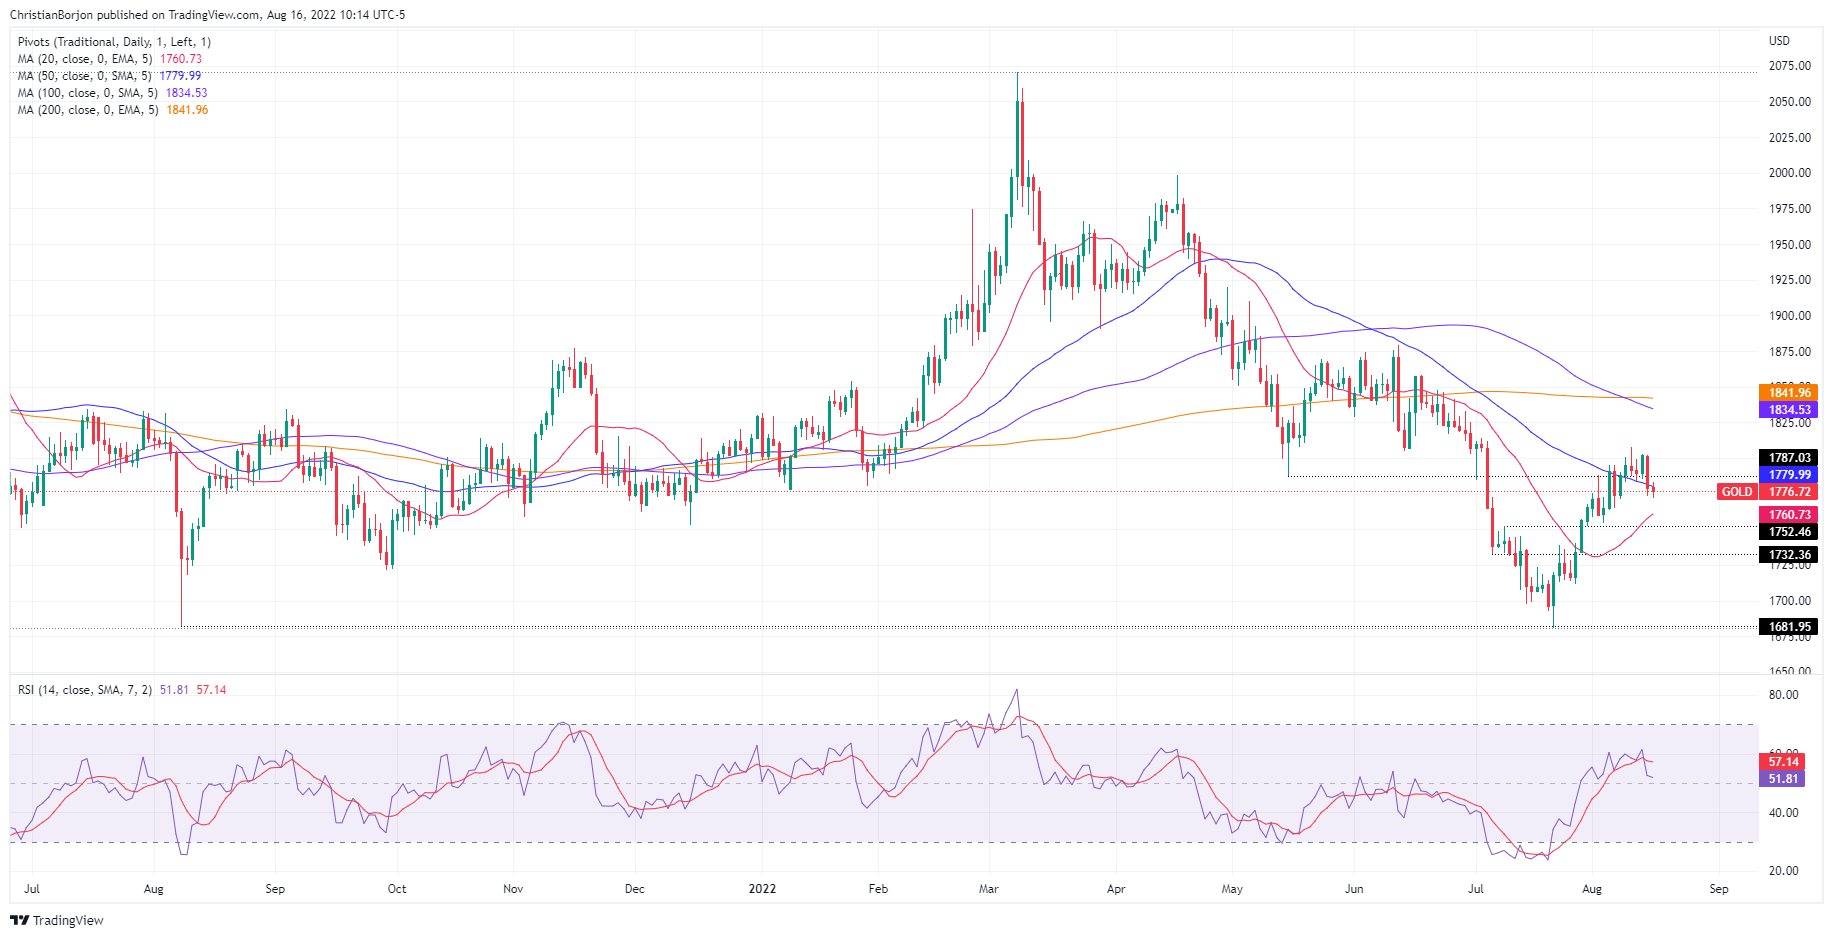
Gold Price Analysis (XAU/USD): Technical outlook
From a daily chart perspective, XAU/USD is neutral biased, clinging underneath the 50-day EMA at $1780. It’s worth noting that the RSI points downwards, closing to the 50-midline, and the 100-day EMA crossed below the 200-day EMA, which could exacerbate a move lower. Nevertheless, unless sellers reclaim the 20-day EMA at $1760.70, consolidation in the $1780-$1810 area is on the cards.
Author

Christian Borjon Valencia
FXStreet
Markets analyst, news editor, and trading instructor with over 14 years of experience across FX, commodities, US equity indices, and global macro markets.


