Gold Price Forecast: XAU/USD rises to near $3,360 ahead of Trump-Zelenskyy meet at White House
- Gold price trades higher as investors turn cautious ahead of Trump-Zelenskyy meeting.
- US President Trump and Russian leader Putin met each other in Alaska on Friday.
- Traders are confident that the Fed will cut interest rates in September.

Gold price (XAU/USD) moves higher to near $3,360 during the European trading session on Monday. The precious metal gains as financial market participants turn cautious ahead of meeting between United States (US) President Donald Trump, Ukrainian President Volodymyr Zelenskyy, and a few NATO members at the White House during the day.
Leaders from Europe and US President Trump are expected to discuss concessions proposed by Russian leader Vladimir Putin, in a summit with Trump in Alaska on Friday, for ending war in Ukraine.
The post from Donald Trump on Truth.Social signals that Ukraine needs to push backs its ambitions of claiming Russian-occupied region of Crimea and NATO membership.
“President Zelenskyy of Ukraine can end the war with Russia almost immediately, if he wants to, or he can continue to fight. Remember how it started. No getting back Obama given Crimea (12 years ago, without a shot being fired!), and NO GOING INTO NATO BY UKRAINE. Some things never change!!!,” Trump wrote.
Signs of a truce between Russia and Ukraine would dampen the appeal of safe-haven assets, such as Gold.
This week, investors will also focus on the Jackson Hole Symposium, which is scheduled for August 21-23. Investors will pay close attention Fed Chair Jerome Powell’s comments for fresh cues on the US interest rate outlook.
In the July’s monetary policy meeting, Jerome Powell argued in favor of a “wait and see” approach as the tariff impact has started feeding into prices. Meanwhile, traders are confident that the Fed will cut interest rates in the September policy meeting, according to the CME FedWatch tool.
Lower interest rates by the Fed bode well for non-yielding assets, such as Gold.
Gold technical analysis
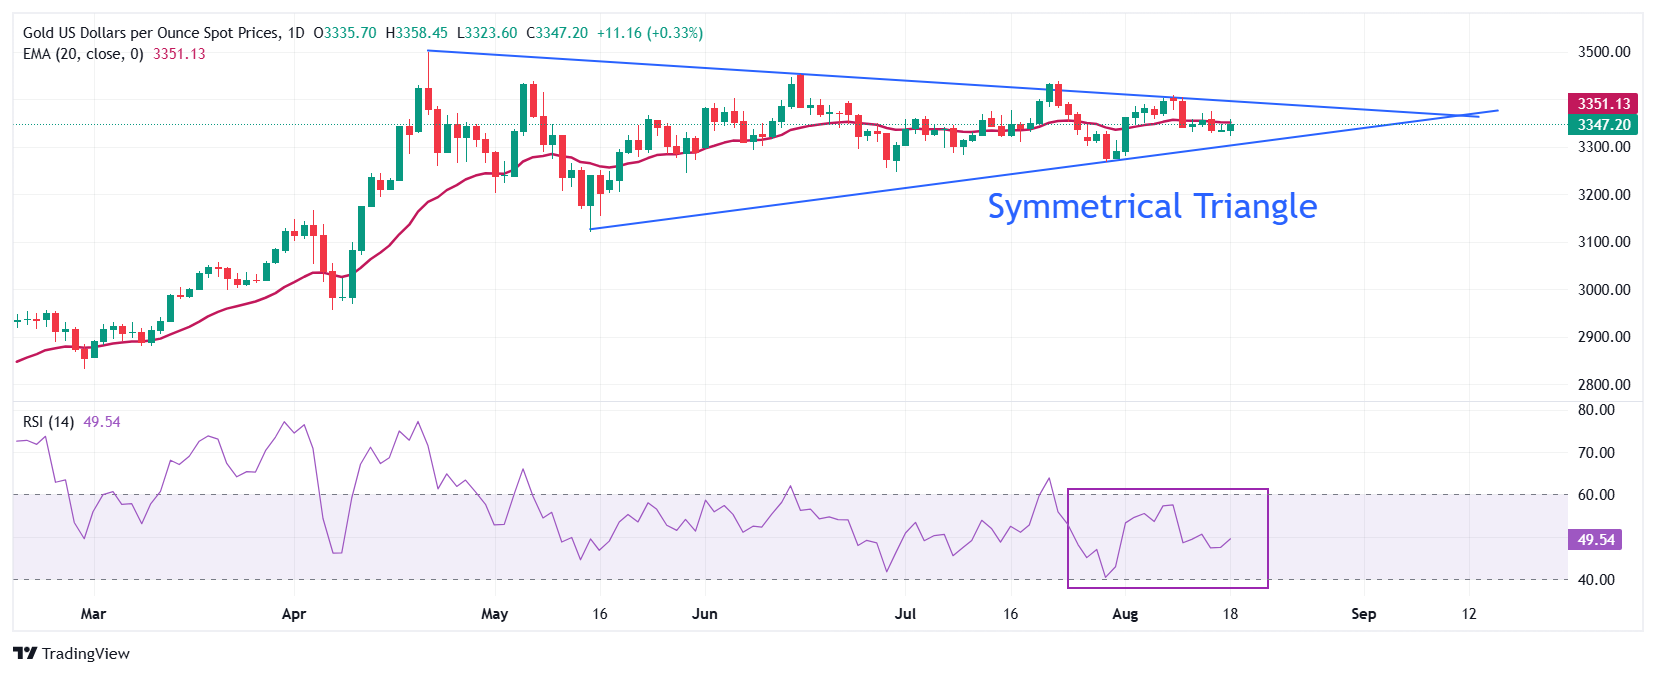
Gold price trades in a Symmetrical Triangle, which indicates a sharp volatility contraction. The upper border of the above-mentioned chart pattern is plotted from the April 22 high around $3,500, while the downward border is placed from the May 15 low near $3,180.86.
The yellow metal wobbles near the 20-day Exponential Moving Average (EMA) around $3,351.00, indicating a sideways trend.
The 14-day Relative Strength Index (RSI) oscillates inside the 40.00-60.00 range, suggesting indecisiveness among market participants.
Looking down, the Gold price would fall towards the round-level support of $3,200 and the May 15 low at $3,121, if it breaks below the May 29 low of $3,245.
Alternatively, the Gold price will enter an uncharted territory if it breaks above the psychological level of $3,500 decisively. Potential resistances would be $3,550 and $3,600.
Gold daily chart
Gold FAQs
Gold has played a key role in human’s history as it has been widely used as a store of value and medium of exchange. Currently, apart from its shine and usage for jewelry, the precious metal is widely seen as a safe-haven asset, meaning that it is considered a good investment during turbulent times. Gold is also widely seen as a hedge against inflation and against depreciating currencies as it doesn’t rely on any specific issuer or government.
Central banks are the biggest Gold holders. In their aim to support their currencies in turbulent times, central banks tend to diversify their reserves and buy Gold to improve the perceived strength of the economy and the currency. High Gold reserves can be a source of trust for a country’s solvency. Central banks added 1,136 tonnes of Gold worth around $70 billion to their reserves in 2022, according to data from the World Gold Council. This is the highest yearly purchase since records began. Central banks from emerging economies such as China, India and Turkey are quickly increasing their Gold reserves.
Gold has an inverse correlation with the US Dollar and US Treasuries, which are both major reserve and safe-haven assets. When the Dollar depreciates, Gold tends to rise, enabling investors and central banks to diversify their assets in turbulent times. Gold is also inversely correlated with risk assets. A rally in the stock market tends to weaken Gold price, while sell-offs in riskier markets tend to favor the precious metal.
The price can move due to a wide range of factors. Geopolitical instability or fears of a deep recession can quickly make Gold price escalate due to its safe-haven status. As a yield-less asset, Gold tends to rise with lower interest rates, while higher cost of money usually weighs down on the yellow metal. Still, most moves depend on how the US Dollar (USD) behaves as the asset is priced in dollars (XAU/USD). A strong Dollar tends to keep the price of Gold controlled, whereas a weaker Dollar is likely to push Gold prices up.
Author

Sagar Dua
FXStreet
Sagar Dua is associated with the financial markets from his college days. Along with pursuing post-graduation in Commerce in 2014, he started his markets training with chart analysis.


