Gold Price Forecast: XAU/USD oscillates between $1,935 and $1,915, US soft landing eyed – Confluence Detector
- Gold Price seesaws within key trading range despite the previous day’s heavy loss.
- Market’s consolidation amid China stimulus hopes, anxiety ahead of US data allow XAU/USD bears to take a breather.
- Fears of economic slowdown in Beijing contradict US soft landing chatters and weigh on the Gold Price.
- US ISM Services PMI, Fed talks eyed for fresh impulse.

Gold Price (XAU/USD) portrays a corrective bounce from the weekly low as it prods the four-day losing streak ahead of the key US data amid sluggish markets. In doing so, the XAU/USD price struggles to justify the latest cautious optimism driven by Chinese property stocks, amid hopes of more stimulus for the real estate sector, as fears of economic slowdown in Beijing join hawkish statements from the Fed officials.
Recently upbeat US employment and activity data defends the Fed’s “higher for longer” bias for the rates and defends the hopes of witnessing a soft landing in the US, which in turn underpins the US Dollar and weighs on the Gold Price. Elsewhere, strong yields and the US Dollar, as well as the US-China tensions, also exert downside pressure on the market’s risk appetite and the XAU/USD.
Moving forward, the US ISM Services PMI and the final prints of the US S&P Global PMIs will be crucial to confirm the US growth concerns, as well as back the hawkish Fed talks, which in turn may keep the Gold bears hopeful on flashing upbeat outcomes. Also, the market’s fears emanating from China and developments surrounding the same could act as additional catalysts for the XAU/USD traders to watch.
Also read: Gold Price Forecast: XAU/USD remains vulnerable, looks to $1,916 confluence support
Gold Price: Key levels to watch
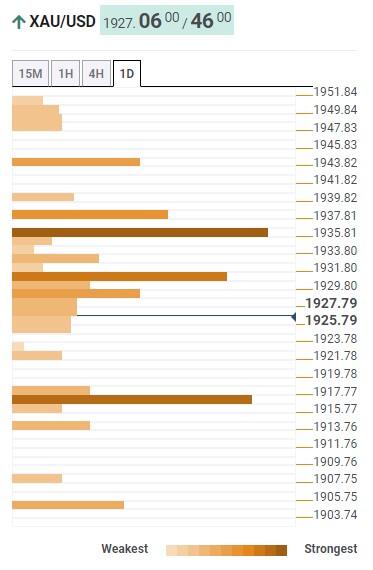
As per our Technical Confluence indicator, the Gold Price seesaws within a strong trading range between $1,935 and $1,915 despite the previous day’s heavy fall, the biggest in five weeks.
That said, the Pivot Point one-day R1, Fibonacci 61.8% on one-month and 50-SMA on the hourly (H1) play restricts the immediate upside of the XAU/USD.
On the contrary, a convergence of the Fibonacci 38.2% on one-month, Pivot Point one-day S2, one-week S1 and 200-SMA on one-day puts a floor under the Gold Price.
It’s worth noting that the Fibonacci 38.2% on one-day and 200-SMA on one-day, around $1,931, restricts the immediate upside of the Gold Price while the Fibonacci 23.6% on one-month, close to $1,905 acts as an extra filter towards the south.
Meanwhile, Fibonacci 23.6% on one-week and Pivot Point one-day R2, close to $1,943, acts as the last defense of the Gold sellers.
Overall, the Gold Price remains depressed despite the latest inaction within the key trading range.
Here is how it looks on the tool
About Technical Confluences Detector
The TCD (Technical Confluences Detector) is a tool to locate and point out those price levels where there is a congestion of indicators, moving averages, Fibonacci levels, Pivot Points, etc. If you are a short-term trader, you will find entry points for counter-trend strategies and hunt a few points at a time. If you are a medium-to-long-term trader, this tool will allow you to know in advance the price levels where a medium-to-long-term trend may stop and rest, where to unwind positions, or where to increase your position size.
Author

Anil Panchal
FXStreet
Anil Panchal has nearly 15 years of experience in tracking financial markets. With a keen interest in macroeconomics, Anil aptly tracks global news/updates and stays well-informed about the global financial moves and their implications.


