Gold Price Forecast: XAU/USD remains vulnerable, looks to $1,916 confluence support
- Gold price licks wounds early Wednesday after breaking its range to the downside on Tuesday.
- US Dollar benefits from US Treasury bond yields rally amid growth fears and rising oil prices.
- Bear Cross remains in play; RSI flips bearish. Gold price could see more downside.

Gold price is sitting at fresh six-day lows near $1,925, pausing its four-day losing streak, as the United States Dollar (USD) rally takes a breather ahead of the release of a fresh batch of high-impact economic data from the US.
Focus on oil prices, US Treasury bond yields and ISM PMI
The strength in the US Dollar alongside the US Treasury bond yields remains the key underlying factor weighing on Gold price so far this week. Following a holiday-thinned subdued trading on Monday, the US Dollar bulls regained the upbeat momentum on risk-aversion, fuelled by resurfacing global growth fears.
Continued property markets and slowdown concerns from China accentuated recession fears, especially amid the ongoing surge in oil prices. Oil prices jumped to 10-month highs after Russia and Saudi Arabia announced the extension of voluntary oil supply cuts. Higher energy prices stoke up worries over inflation and expectations that the central banks may have to continue their tightening cycle to tame inflation, which could risk the global economy dipping into recession.
Downward revisions to the Eurozone and the UK business activity data, slowing growth in China’s services sector and downbeat Factor Orders data from the United States contributed to the renewed global economic woes. Investors flocked to the safety of the US Dollar, smashing Gold price to a six-day low of $1,924.
However, the US Dollar ignored dovish remarks from US Federal Reserve (Fed) Governor Christopher Waller. Waller said on Tuesday that the recent encouraging US data flow will allow the Fed some time to assess if it needs to raise interest rates again and that he saw nothing that would force a move toward boosting the cost of short-term borrowing again.
Attention now turns toward the top-tier US ISM Services PMI data due later in the North American session Wednesday. In contrast, the final S&P Services PMI and the Good Trade Balance data will entertain Gold traders. They will keep a close eye on the oil price action, which could likely influence the broader market sentiment and the dynamics of the US Treasury bond yields.
Gold price technical analysis: Daily chart
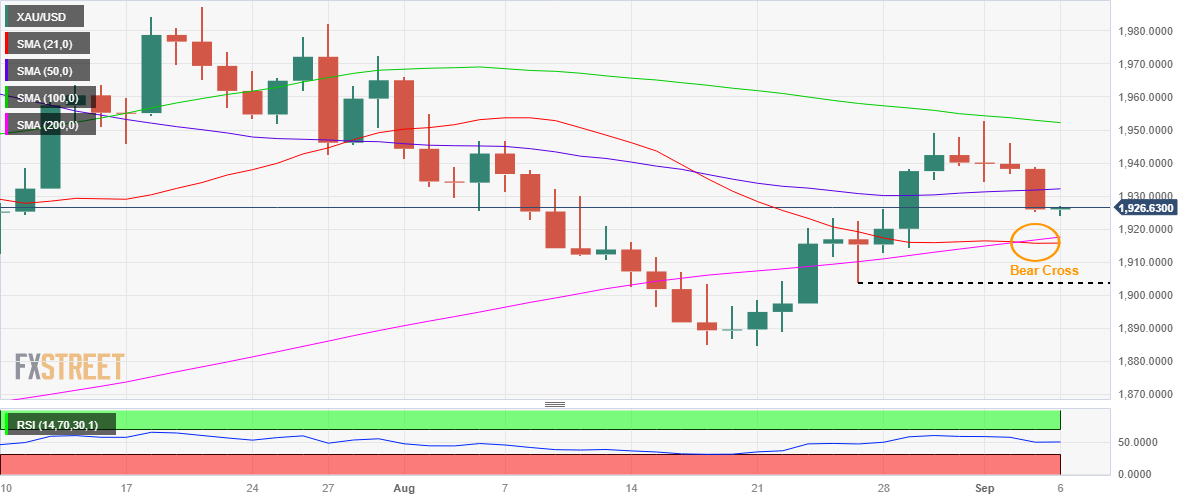
On Tuesday, Gold price broke the range trade between the key 100-day Moving Average (DMA) at $1,952 and the mildly bullish 50 DMA at $1,932 to the downside after piercing through the latter on a daily closing basis.
The next relevant support aligns at the $1,916 level, the 21 and 200 DMA confluence. The downside bias remains intact for the Gold price, as the 21 and 200 DMAs Bear Cross remains in play.
The 14-day Relative Strength Index (RSI) breached the midline for the downside, turning the tide in favor of Gold sellers. Deeper declines will put the previous week’s low of $1,904 back in sight.
Alternatively, the Gold price will need to recapture the 50 DMA support-turned-resistance at $1,932 on a daily closing basis to make another run toward the 100 DMA hurdle at $1,952. Further up, the static resistance of $1,970 and the July 27 high of $1,982 will challenge the Gold price recovery.
Author

Dhwani Mehta
FXStreet
Residing in Mumbai (India), Dhwani is a Senior Analyst and Manager of the Asian session at FXStreet. She has over 10 years of experience in analyzing and covering the global financial markets, with specialization in Forex and commodities markets.

















