Gold Price Forecast: XAU/USD needs to crack $1,763 to extend the downside – Confluence Detector
- Gold price nurses losses after impressive US NFP-inspired sell-off.
- US dollar eases in tandem with the Treasury yields amid a better mood.
- XAU/USD looks south towards $1,750, as 75 bps Sept Fed rate hike bets rise.

Gold price is licking its wound below the $1,800 mark, awaiting a fresh catalyst for the next leg lower. Risk-on flows have returned at the start of the week, fuelling a broad-based US dollar retreat while the Treasury yields also ease. Investors assess the implications of a super-sized Fed rate next months, the odds for which now stand at 70% after a big upside surprise in the US Nonfarm Payrolls for July. The jobs blowout raised the stakes for the July US inflation report due on Wednesday. The US Consumer Price Index (CPI) could likely see a slight pullback in headline growth but the core figure is seen accelerating. The debate of peak inflation remains in play heading into the key event risk of the week. The non-yielding bullion is expected to remain highly reactive to the US employment and inflation data after the Fed said that it remains data-dependent while deciding on its policy outlook.
Also read: Gold Price Forecast: XAU/USD could challenge $1,750, with big Fed rate hike bets back in play
Gold Price: Key levels to watch
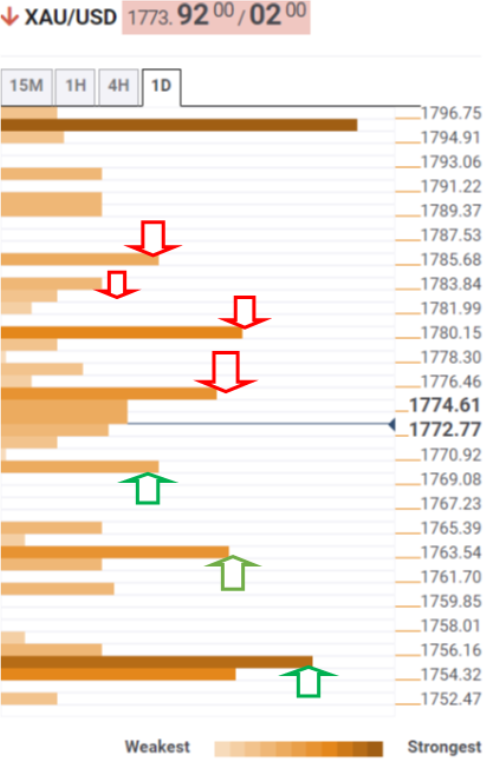
The Technical Confluence Detector shows that the gold price needs to slice through a bunch of healthy support levels around the $1,772-$1,771 area to resume the post-NFP sell-off.
That demand zone is the convergence of the SMA5 one-day, Fibonacci 23.6% one-day and the previous low four-hour.
The Fibonacci 61.8% one-week at $1,769 will be next on sellers’ radars. However, bears need acceptance below the confluence of the Fibonacci 61.8% one-month and pivot point one-day S1 at $1,763 to negate the recent bullish momentum.
Further south, the intersection of the previous week’s low and the pivot point one-week S1 at $1,754 will guard the downside.
On the upside, the immediate resistance appears at $1,775, above which the Fibonacci 38.2% one-week at %1,780 will be challenged.
The next resistance levels are located at $1,784 and $1,786, which are the Fibonacci 61.8% one-day and Fibonacci 23.6% one-week respectively.
Here is how it looks on the tool
About Technical Confluences Detector
The TCD (Technical Confluences Detector) is a tool to locate and point out those price levels where there is a congestion of indicators, moving averages, Fibonacci levels, Pivot Points, etc. If you are a short-term trader, you will find entry points for counter-trend strategies and hunt a few points at a time. If you are a medium-to-long-term trader, this tool will allow you to know in advance the price levels where a medium-to-long-term trend may stop and rest, where to unwind positions, or where to increase your position size.
Author

Dhwani Mehta
FXStreet
Residing in Mumbai (India), Dhwani is a Senior Analyst and Manager of the Asian session at FXStreet. She has over 10 years of experience in analyzing and covering the global financial markets, with specialization in Forex and commodities markets.


