|

Gold Price Forecast: XAU/USD juggles around $1,720 as DXY turns subdued, US ADP job data buzz

  • Gold price is playing in a limited territory around $1,720.00 ahead of US ADP Employment data.
  • The risk sentiment is displaying a mixed response as yields have turned sideways.
  • The event of the US NFP will display the true status of the US labor market.

Gold price (XAU/USD) oscillating around $1,720.00 after dropping from $1,726.50 as investors are awaiting the US Automatic Data Processing (ADP) employment data release for fresh cues. Fresh demand recorded in the US dollar index (DXY) from 110.20 is fading now as the fragile rebound move is met with significant offers of around 110.50.

Risk-profile is displaying mixed response as yields have turned sideways. The 10-year benchmark US Treasury yields are hovering below their day’s high of 3.64%.

FX domain needs fresh impetus for a decisive move and investors have shifted their focus toward the US ADP data. As per the projections, the US labor market has witnessed a fresh addition of 200k jobs in September vs. the former addition of 132k. The status of lower job additions could compel the Federal Reserve (Fed) to slow down the pace of hiking interest rates as economic projects are needed to be cared for while combating the inflationary pressures.

Later this week, the US Nonfarm Payrolls (NFP) data will provide the true picture of employment status in the US. Considering the US NFP data, the US economy has created 250k jobs in September, lower than the August reading of 315k.

Gold technical analysis

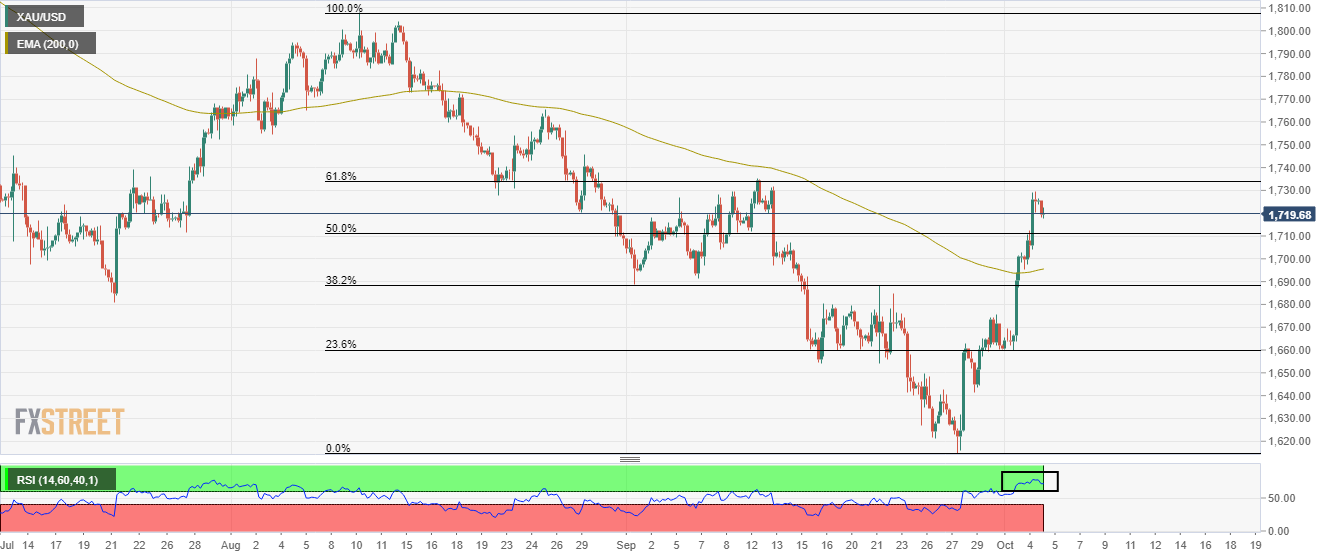
Signs of exhaustion in the uptrend are clearly visible in the gold prices after failing to continue the bumper rally towards the 61.8% Fibonacci retracement (placed from August 10 high at $1,807.93 to September low at $1,614.85) at $1,734.58. Consideration of a bearish reversal could be a little early as corrective moves are generally observed after a juggernaut rally.

The gold prices are comfortably established above the 200-period Exponential Moving Average (EMA) at $1,696.00.

The Relative Strength Index (RSI) (14) is showing a bullish bias as it is oscillating in a bullish range of 60.00-80.00. However, a correction towards 60.00 cannot be ruled out.

Gold four-hour chart

XAU/USD

Overview
Today last price1718.55
Today Daily Change-7.63
Today Daily Change %-0.44
Today daily open1726.18
 
Trends
Daily SMA201679.83
Daily SMA501724.74
Daily SMA1001763.48
Daily SMA2001823.63
 
Levels
Previous Daily High1729.58
Previous Daily Low1695.18
Previous Weekly High1675.49
Previous Weekly Low1614.85
Previous Monthly High1735.17
Previous Monthly Low1614.85
Daily Fibonacci 38.2%1716.44
Daily Fibonacci 61.8%1708.32
Daily Pivot Point S11704.38
Daily Pivot Point S21682.58
Daily Pivot Point S31669.98
Daily Pivot Point R11738.78
Daily Pivot Point R21751.38
Daily Pivot Point R31773.18

Author

Sagar Dua

Sagar Dua

FXStreet

Sagar Dua is associated with the financial markets from his college days. Along with pursuing post-graduation in Commerce in 2014, he started his markets training with chart analysis.

More from Sagar Dua
Share:

Editor's Picks

EUR/USD looks to regain the 200-day SMA

EUR/USD regains some balance and trade just above 1.1600 the figure ahead of the opening bell in Asia. The pair initially dipped to the 1.1530 zone for the first time since November, always following the stronger US Dollar and the marked flight-to-safety in the context of the ongoing Middle East crisis
 

GBP/USD attacks 1.3300, refreshing three-month lows

GBP/USD is deep in the red near 1.3300, accelerating its downside to renew three-month lows in European trading on Tuesday. The ongoing escalation in the Iran war, combined with rising Oil prices, weighs negatively on the higher-yielding Pound Sterling as the US Dollar capitalizes on increased haven demand.

Gold bounces off lows, back above $5,100

Gold remains on the defensive, eroding part of the recent multi-day advance and managing to trade back above the $5,100 mark per troy ounce on Tuesday. The precious metal initially dropped just below the critical $5,000 threshold on the back of the persistent strength of the Greenback, higher US Treasury yields across the curve and investors' repricing of Fed rate cuts.

XRP risks extending losses as US-Iran war rages on

Ripple (XRP) has come under pressure, drifting lower to $1.35 at the time of writing on Tuesday. The over 2% correction looks poised to erase the previous day’s gains, which lifted the remittance token to $1.42.

Energy shock 2.0: Why rising Gas prices could hit the Euro

Even without a confirmed, sustained disruption, the mere risk to a key global energy chokepoint is enough to inject a significant premium into European Gas markets. And for the Euro, that matters.

Ripple falters amid sell-off jitters and negative funding rates

Ripple (XRP) has come under pressure, drifting lower to $1.35 at the time of writing on Tuesday. The over 2% correction looks poised to erase the previous day’s gains, which lifted the remittance token to $1.42.