Gold Price Forecast: XAU/USD is looking for direction right below $4,100
- Gols found support near $4,040 but remains unable to extend its recovery beyond $4,100.
- Investors remain cautious ahead of the release of delayed US data.
- Technically, Gold shows ongoing bearish pressure, although momentum indicators are turning flat.

Gold’s (XAU/USD) reversal from monthly highs near $4,250 hit last week has been contained above $4,040, but the precious metal is trading sideways on Monday with upside attempts capped below the $4,100 so far. Investors are looking from the sidelines, awaiting the release of delayed US macroeconomic data.
Precious metals are wavering, with choppy trading prevailing during the Asian and European sessions. Recent comments from Fed officials have been tilted to the hawkish side, providing some support to the US Dollar, but traders are reluctant to place directional bets, awaiting a backlog of US macroeconomic figures for a more precise outlook on the US economy and the Federal Reserve’s monetary policy.
Technical Analysis: Treading water halfway through November’s range
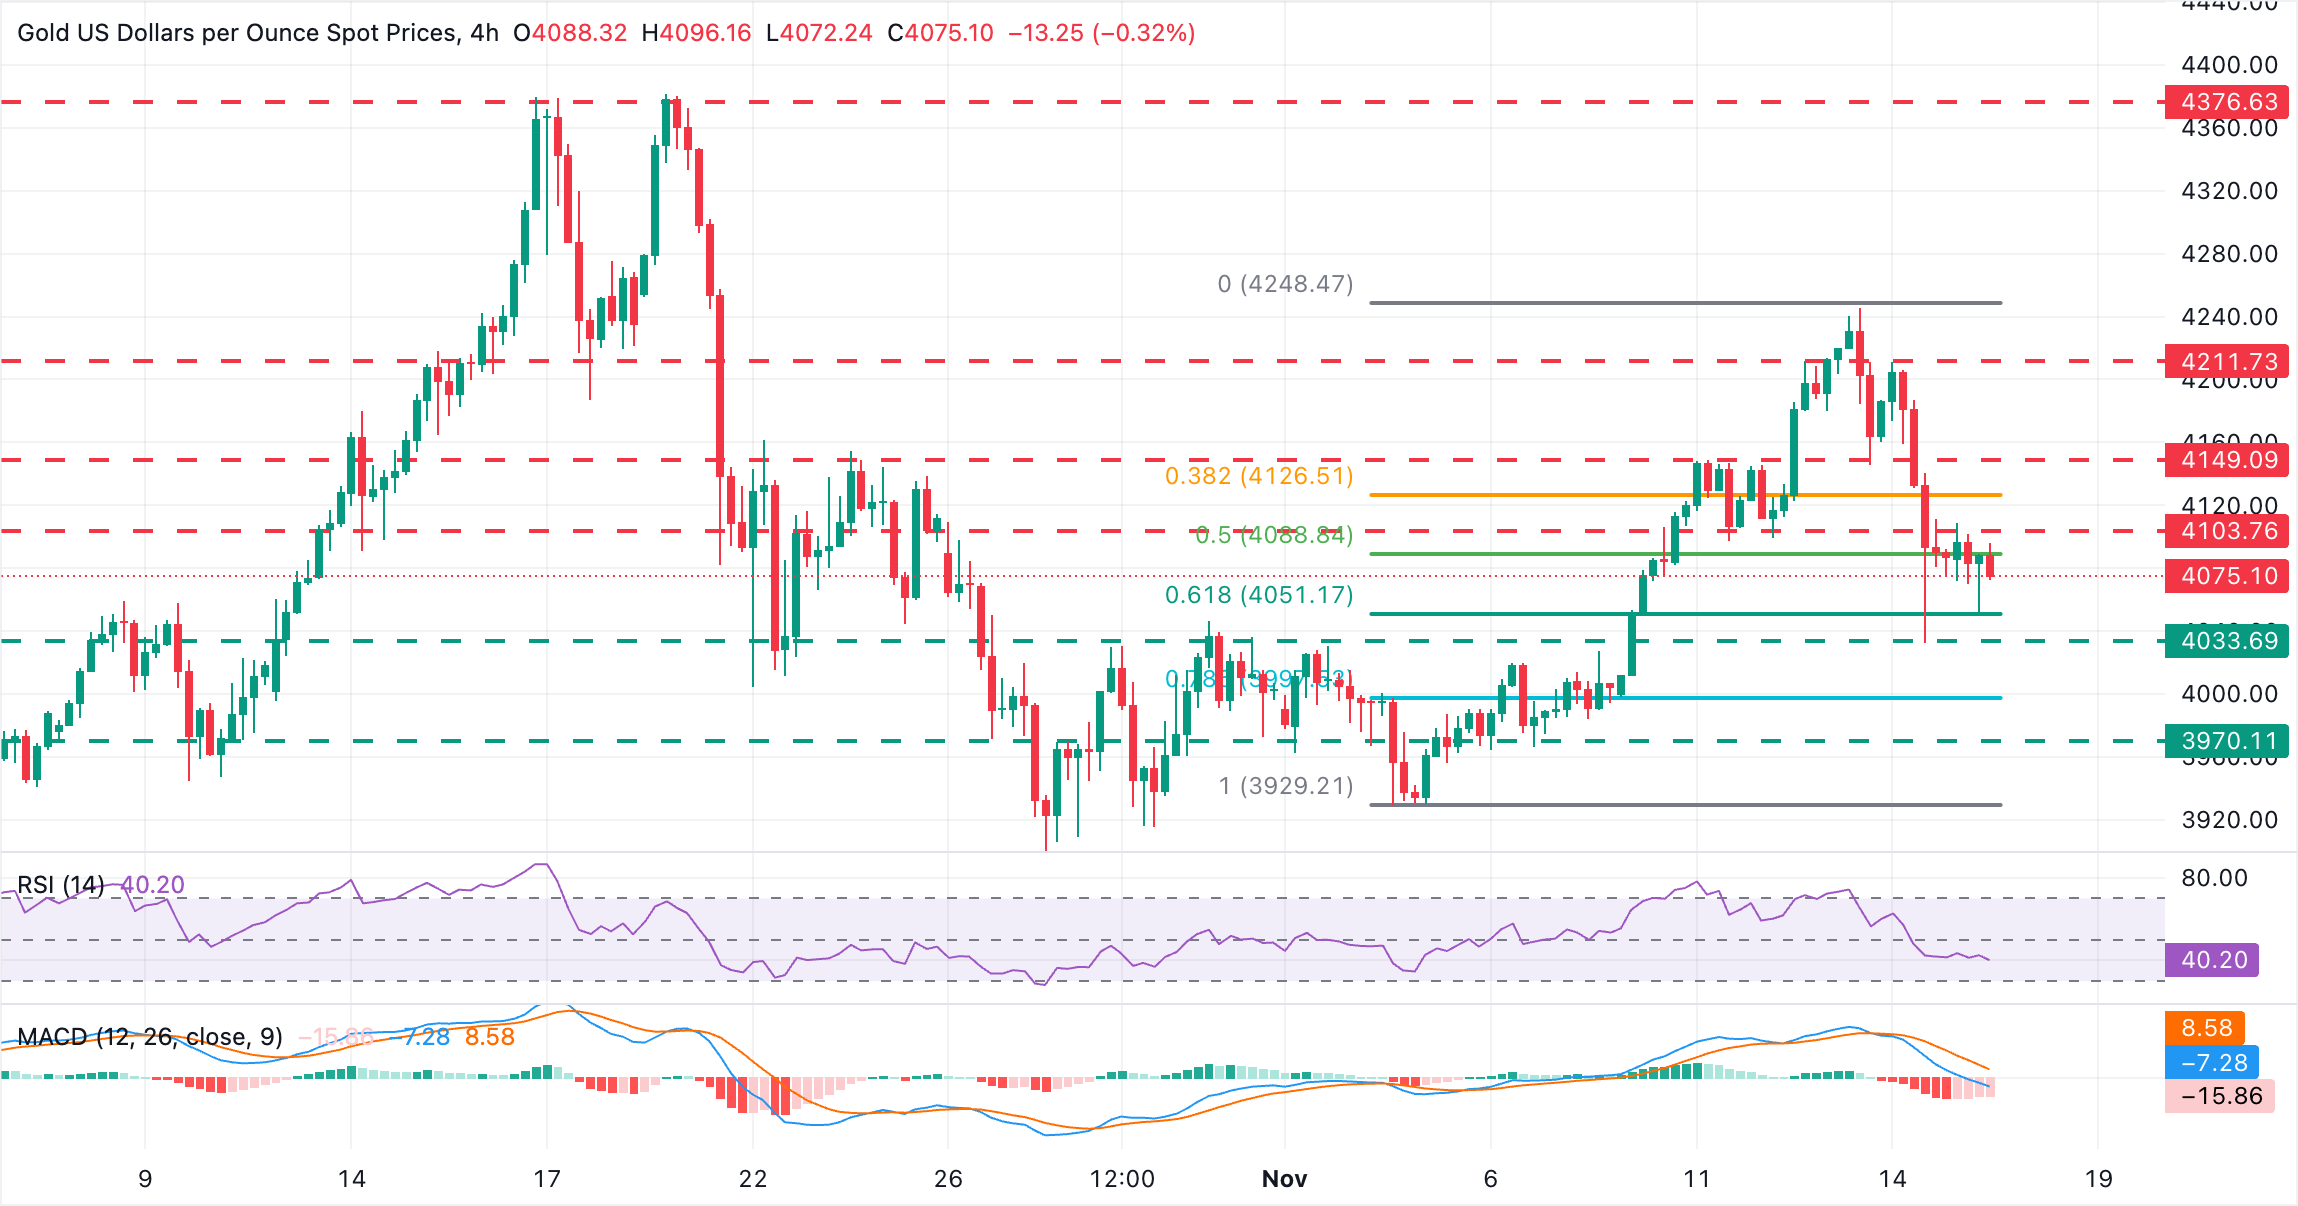
The technical picture remains moderately bearish, following a 2.6% reversal over the last two trading days. The 4-Hour Relative Strength Index (RSI) has flatlined below the 50 level, and the Moving Average Convergence Divergence (MACD) continues to print red bars in the histogram. Although the MACD line is showing signs of bottoming, this suggests that the immediate bearish trend is losing momentum.
The pair has strong support in the area around $4,040, where the 61.8% Fibonacci retracement of the early November rally meets the November 14 low. This Fibonacci level is a common target for corrections. Nevertheless, below here, the target is the $4,000, a psychological level, and the 78,6% Fibonacci retracement of the same cycle.
Resistance is at the mentioned $4,100a area (session highs) ahead of the November 11 high and November 13 low of $4,170, which guards the path towards last week’s highs of $4,210 and $4,250 (November 14 and 13 respectively).
Gold FAQs
Gold has played a key role in human’s history as it has been widely used as a store of value and medium of exchange. Currently, apart from its shine and usage for jewelry, the precious metal is widely seen as a safe-haven asset, meaning that it is considered a good investment during turbulent times. Gold is also widely seen as a hedge against inflation and against depreciating currencies as it doesn’t rely on any specific issuer or government.
Central banks are the biggest Gold holders. In their aim to support their currencies in turbulent times, central banks tend to diversify their reserves and buy Gold to improve the perceived strength of the economy and the currency. High Gold reserves can be a source of trust for a country’s solvency. Central banks added 1,136 tonnes of Gold worth around $70 billion to their reserves in 2022, according to data from the World Gold Council. This is the highest yearly purchase since records began. Central banks from emerging economies such as China, India and Turkey are quickly increasing their Gold reserves.
Gold has an inverse correlation with the US Dollar and US Treasuries, which are both major reserve and safe-haven assets. When the Dollar depreciates, Gold tends to rise, enabling investors and central banks to diversify their assets in turbulent times. Gold is also inversely correlated with risk assets. A rally in the stock market tends to weaken Gold price, while sell-offs in riskier markets tend to favor the precious metal.
The price can move due to a wide range of factors. Geopolitical instability or fears of a deep recession can quickly make Gold price escalate due to its safe-haven status. As a yield-less asset, Gold tends to rise with lower interest rates, while higher cost of money usually weighs down on the yellow metal. Still, most moves depend on how the US Dollar (USD) behaves as the asset is priced in dollars (XAU/USD). A strong Dollar tends to keep the price of Gold controlled, whereas a weaker Dollar is likely to push Gold prices up.
Author

Guillermo Alcala
FXStreet
Graduated in Communication Sciences at the Universidad del Pais Vasco and Universiteit van Amsterdam, Guillermo has been working as financial news editor and copywriter in diverse Forex-related firms, like FXStreet and Kantox.


