Gold Price Forecast: XAU/USD holds gains above $1,900, downside looks supportive amid solid yields
- Gold price oscillates above $1,900.00. However, the downside seems favored amid soaring yields.
- Fed Barkin cited that backing off from interest rate hiking too soon is not favorable.
- Higher monthly US Retail Sales data might rebound inflation projections.

Gold price (XAU/USD) displays a sideways auction profile above the round-level support of $1,900.00 in the Asian session. The precious metal is managing to sustain above $1,900.00. However, the downside seems supportive amid rising US Treasury yields after the hawkish commentary from Richmond Federal Reserve (Fed) Bank President Tom Barkin.
Fed policymakers cited that the economy has passed the phase of inflation peak, but we are still far from the median Consumer Price Index (CPI). Therefore, backing off from interest rate hiking too soon is not favorable.
Meanwhile, volatility in the market is escalating as risk-perceived assets are losing traction. S&P500 futures have accelerated their losses, indicating strength in the risk-aversion theme. A decline in the risk appetite of the market participants has also weakened the demand for US government bonds. This has led to an increment in the 10-year US Treasury yields above 3.54%.
Going forward, investors will focus on the United States Producer Price Index (PPI) (Dec) and monthly Retail Sales (Dec) data. As per the estimates, the headline PPI (Dec) is seen lower at 6.8%, while the core PPI is seen declining to 5.9%. Additionally, monthly Retail Sales data might show an expansion of 0.1% vs. the contraction of 0.6% released earlier. Improvement in Retail Sales data might bolster the odds of a rebound in inflation projections.
Gold technical analysis
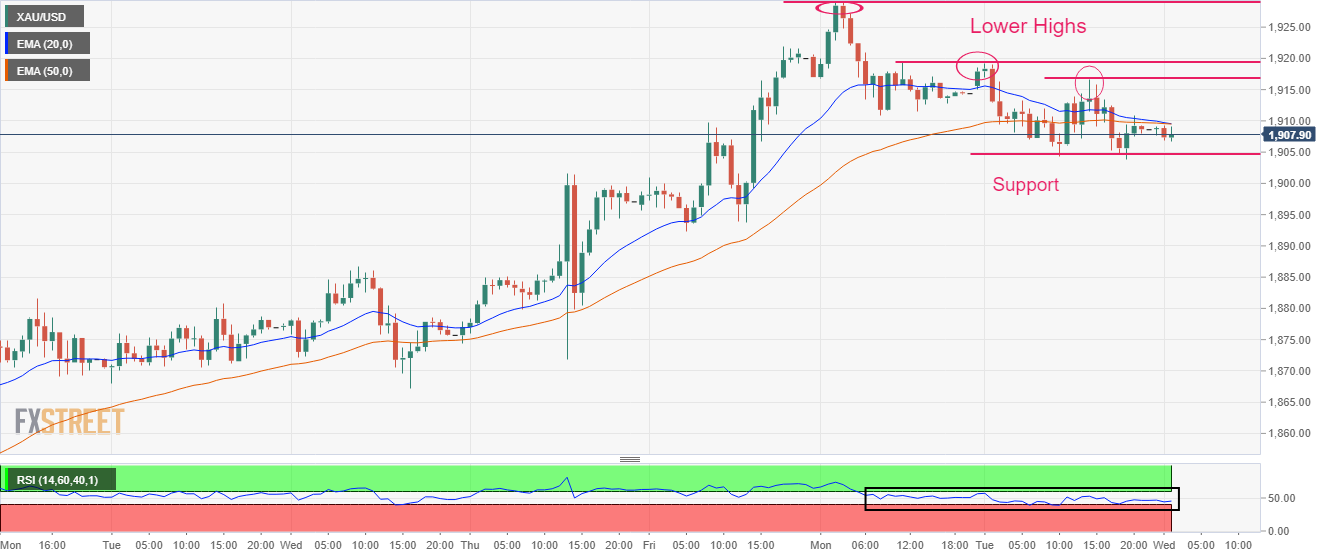
Gold price demonstrates the formation of Lower Highs on an hourly scale, communicating signs of bearish reversal. The precious metal might display sheer weakness after breaking the horizontal support plotted from Tuesday’s low marginally below $1,905.00.
The 20-and 50-period Exponential Moving Averages (EMAs) are on the verge of delivering a bearish cross over around $1,909.00.
The Relative Strength Index (RSI) (14) oscillates in a 40.00-60.00 range. A slippage into the bearish range of 20.00-40.00 will activate a bearish momentum.
Gold hourly chart
Author

Sagar Dua
FXStreet
Sagar Dua is associated with the financial markets from his college days. Along with pursuing post-graduation in Commerce in 2014, he started his markets training with chart analysis.


