Gold Price Forecast: XAU/USD gyrates within $1,955-73 trading zone – Confluence Detector
- Gold Price fades week-start recovery from key support confluence amid dicey markets.
- Mixed concerns about Federal Reserve, US-China ties prod XAU/USD traders.
- Light calendar, pre-FOMC blackout of Fed policymakers restrict market moves.
- Softer Treasury bond yields exert downside pressure on US Dollar, put a floor under the Gold Price.

Gold Price (XAU/USD) aptly portrays the sluggish markets heading into Tuesday’s European session, after an indecisive week. In doing so, the XAU/USD highlights a lack of major data/events on the economic calendar, as well as mixed concerns about the Federal Reserve’s (Fed) moves and the diplomatic ties between the US and China.
Recent headlines suggest the Sino-American talks are going smoothly but the Taiwan tension keeps poking the optimists. On the other hand, softer US data and previous Fed talks push traders to anticipate nearness to the policy pivot. However, the comments from International Monetary Fund (IMF) Managing Director Kristalina Georgieva hint at more rate hikes from the US central bank and weigh on the Gold Price. Furthermore, the US debt-ceiling deal passage and looming fears about the banking sector adds strength to the downside bias surrounding XAU/USD.
Against this backdrop, the US Treasury bond yields remain pressured as traders rush to the US bonds for risk safety. That said, the US stock futures and the US Dollar Index (DXY) remain directionless of late.
Also read: Gold Price Forecast: XAU/USD could see choppy trading between two key DMAs
Gold Price: Key levels to watch
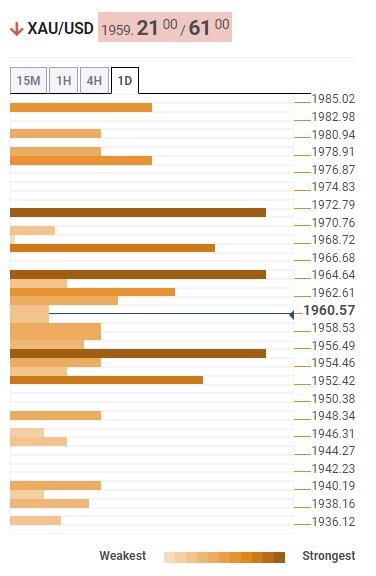
Our Technical Confluence Indicator signals that the Gold Price seesaws with the short-term trading range, dropping towards the support line of late.
That said, a convergence of the middle of the Bollinger on the one-hour joins the 200-HMA to highlight $1,955 as the short-term key support.
Following that, the Fibonacci 61.8% in one-week will join the 10-SMA on four-hour chart to signal $1,952 as an extra filter towards the south.
On the contrary, the Fibonacci 38.2% in one-week and previous daily top together highlight $1,965 as an immediate key upside hurdle.
In a case where the Gold Price crosses the $1,965 hurdle, the Pivot Point one-day R1, the upper of the Bollinger on the one-hour and Fibonacci 23.6% in one-week together carve out $1,973 as the last defense of the XAU/USD bears.
It should be noted that the Gold Price upside past $1,973 won’t hesitate to challenge the $2,000 threshold during a gradual run-up whereas the downside break of $1,955 could quickly fetch the XAU/USD towards the previous monthly low of around $1,932.
Here is how it looks on the tool
About Technical Confluences Detector
The TCD (Technical Confluences Detector) is a tool to locate and point out those price levels where there is a congestion of indicators, moving averages, Fibonacci levels, Pivot Points, etc. If you are a short-term trader, you will find entry points for counter-trend strategies and hunt a few points at a time. If you are a medium-to-long-term trader, this tool will allow you to know in advance the price levels where a medium-to-long-term trend may stop and rest, where to unwind positions, or where to increase your position size
Author

Anil Panchal
FXStreet
Anil Panchal has nearly 15 years of experience in tracking financial markets. With a keen interest in macroeconomics, Anil aptly tracks global news/updates and stays well-informed about the global financial moves and their implications.

















