Gold Price Forecast: XAU/USD grinds beyond $1,940 support, banking crisis, Federal Reserve in focus
- Gold price keeps the previous day’s pullback from YTD high, directionless of late.
- Corrective bounce in United States Treasury bond yields, hawkish Federal Reserve bets prod XAU/USD bulls.
- Banking crisis, successful break of the previous key resistance line favor Gold buyers.

Gold price (XAU/USD) struggles for clear directions around $1,980, following a pullback from the yearly high above $2,000, as markets slip into cautious mode ahead of the key data/events. Also challenging the Gold traders could be the recent rebound in the United States Treasury bond yields and the hawkish Federal Reserve (Fed) bets.
Gold price cheers technical breakout, banking turmoil
Gold price marked a sustained break of a downward-sloping resistance line from August 2020, now support around $1,940, in the last week, which in turn joins the traders’ rush for risk-safety to keep the traditional haven on the bull’s radar despite the latest pullback.
It should be noted that the UBS-Credit Suisse deal and the global central banks’ efforts to tame the liquidity crunch seemed to have tamed the market’s pessimism and allowed the Gold buyers to take a breather. However, the details suggest no relief from the banking fallout and put a floor under the XAU/USD price.
Late Monday, analysts at S&P think that it is unlikely that some US bank failures will prevent policymakers from sticking to the task of taming inflation, reported Reuters early Tuesday in Asia. The global rating agency also mentioned that the decision to write off Credit Suisse's AT1 bonds may contribute to a higher cost of capital for banks. On the same line were comments from a Senior Swiss lawmaker who warned on Monday that “the UBS-Credit Suisse merger is an enormous risk.”
While portraying the mood, Wall Street closed with gains but S&P 500 Futures struggled for clear directions.
XAU/USD retreats on Treasury bond yields’ rebound
While the mixed concerns around the banking turmoil challenge the previous risk-on mood, the United States Treasury bond yields manage to extend the previous day’s corrective bounce, which in turn weighed on the Gold price.
That said, the US 10-year and two-year Treasury bond yields bounced off the lowest levels since September 2022 the previous day, mildly bid during the early Asian hours on Tuesday.
It should be noted that the recently hawkish bets on the Federal Reserve (Fed) also seem to prod the XAU/USD bulls ahead of Wednesday’s Federal Open Market Committee (FOMC) Monetary Policy Meeting. As per the latest read of the CME’s FedWatch tool, the probability of witnessing a 0.25% Fed rate hike on Wednesday is 75%, up from the last week’s 65%.
Moving on, Gold traders should keep their eyes on the risk catalysts, as well as the US Treasury bond yields, for fresh impulse.
Gold price technical analysis
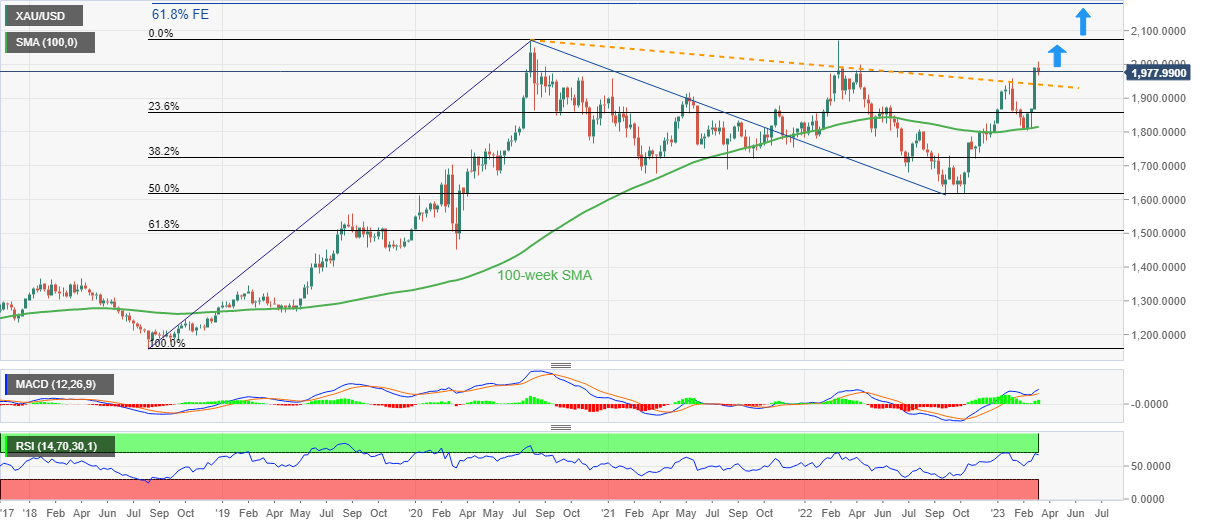
Gold price remains on the bull’s radar, despite the latest pullback from the Year-To-Date (YTD) high as the quote remains well above the previous resistance line from August 2020, breached the last week.
Adding strength to the bullish bias could be the price-positive signals from the Moving Average Convergence and Divergence (MACD) signals.
It’s worth noting that the Relative Strength Index (RSI), placed at 14, flashes overbought signals and hence suggests a pullback in the Gold price.
That said, the XAU/USD retreat remains elusive unless the commodity remains firmer past the resistance-turned-trend line, currently around $1,948.
Even if the quote Gold price remains weak past $1,948, the 100-week Simple Moving Average (SMA) level surrounding $1,815 appears the last defense of the XAU/USD buyers.
Alternatively, sustained trading beyond the $2,000 psychological magnet could give comfort to the bulls in dominating the momentum.
Following that, the tops marked during the years 2020 and 2022, around $2070-75 appear as the key upside hurdles for Gold buyers to watch during the metal’s further advances.
In a case where the XAU/USD remains firmer past the $2,075 hurdle and renews the record high, the 61.8% Fibonacci Expansion (FE) of the Gold price movement between August 2018 and September 2022, near $2,180, will be in focus.
Gold price: Weekly chart
Trend: Further upside expected
Author

Anil Panchal
FXStreet
Anil Panchal has nearly 15 years of experience in tracking financial markets. With a keen interest in macroeconomics, Anil aptly tracks global news/updates and stays well-informed about the global financial moves and their implications.


