Gold Price Forecast: XAU/USD eyes key levels and US inflation – Confluence Detector
- Gold price is easing from near monthly highs ahead of US inflation.
- US CPI will shape the Fed rate hike policy and market sentiment.
- XAU/USD sees healthy barriers on both sides amid a sense of caution.

Gold price is snapping its two-day uptrend to monthly highs of $1,800, as investors resort to repositioning ahead of the highly-influential US inflation release. Markets are reluctant to place large bets heading into the CPI showdown, as the data will be scrutinized closely for fresh insights on how steeply the Fed will raise rates in the coming months. The non-interest-bearing gold braces for huge volatility on the data release, especially after being sold off into the bumper US Nonfarm Payrolls last week. This Wednesday, the odds of a 75 bps Fed lift-off in September stand at 67.5% while the two-year Treasury rate surpasses the 10-year by nearly 50 bps, indicating that the inversion is around the deepest since 2000. A softer US CPI reading is critical to dissuading the Fed from going too aggressive on its rate-hike track amid growing recession fears.
Also read: Gold Price Forecast: Bears cross to challenge XAU/USD bulls ahead of US inflation
Gold Price: Key levels to watch
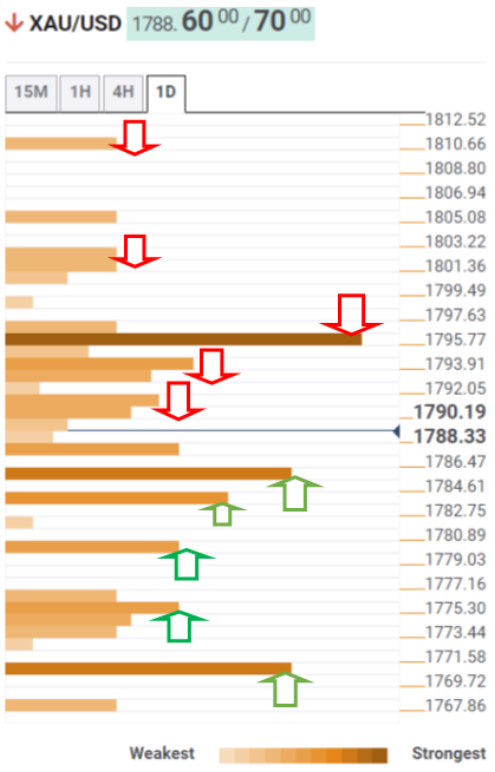
The Technical Confluence Detector shows that the gold price eyes immediate cushion around $1,785, the convergence of the Fibonacci 23.6% one-week, SMA50 one-day and the pivot point one-day S1.
Bears will then attack the previous day’s low of $1,783, where the SMA5 one-day aligns. The next support awaits at the Fibonacci 38.2% one-week at $1,780.
The intersection of the Fibonacci 161.8% and SMA50 four-hour around $1,774 will be next on sellers’ radars, with the last line of defense for buyers seen at $1,770. At that level, the Fibonacci 61.8% one-week meets SMA10 one-day.
On the upside, a powerful resistance is pegged near $1,791, the meeting point of the SMA10 four-hour and the previous low four-hour. The next relevant barrier is seen at the Fibonacci 38.2% one-day at $1,793.
Acceptance above the previous week’s high of $1,795 is important to unleashing the further upside towards the $1,800 round figure.
Bulls will then aim for the $1,805 and $1,810 resistance levels, the Bollinger Band one-day Upper and the pivot point one-day R2 respectively.
Here is how it looks on the tool
About Technical Confluences Detector
The TCD (Technical Confluences Detector) is a tool to locate and point out those price levels where there is a congestion of indicators, moving averages, Fibonacci levels, Pivot Points, etc. If you are a short-term trader, you will find entry points for counter-trend strategies and hunt a few points at a time. If you are a medium-to-long-term trader, this tool will allow you to know in advance the price levels where a medium-to-long-term trend may stop and rest, where to unwind positions, or where to increase your position size.
Author

Dhwani Mehta
FXStreet
Residing in Mumbai (India), Dhwani is a Senior Analyst and Manager of the Asian session at FXStreet. She has over 10 years of experience in analyzing and covering the global financial markets, with specialization in Forex and commodities markets.

















