Gold Price Forecast: XAU/USD eyes a smooth sail towards $1,830 and $1,834 – Confluence Detector
- Gold price hits fresh two-month highs above $1,820 on Monday.
- Gold ignores strong NFP but rebound in yields, USD could cap the rally.
- Gold price turns bullish on falling bond yields, technical breakout.

Gold price remains on track for additional upside, as buyers seize control above the $1,800 mark after the solid comeback seen in the previous week. The Fed’s dovish stance on interest rates hike combined with lower levels of US labor force participation bolstered gold’s upsurge. However, the latest rebound in the US dollar alongside the Treasury yields, despite the cautious risk tone, could likely threaten gold’s bullish streak ahead of Fed Chair Jerome Powell’s speech.
Read: Gold Chart of the Week: Bulls not going down without a fight
Gold Price: Key levels to watch
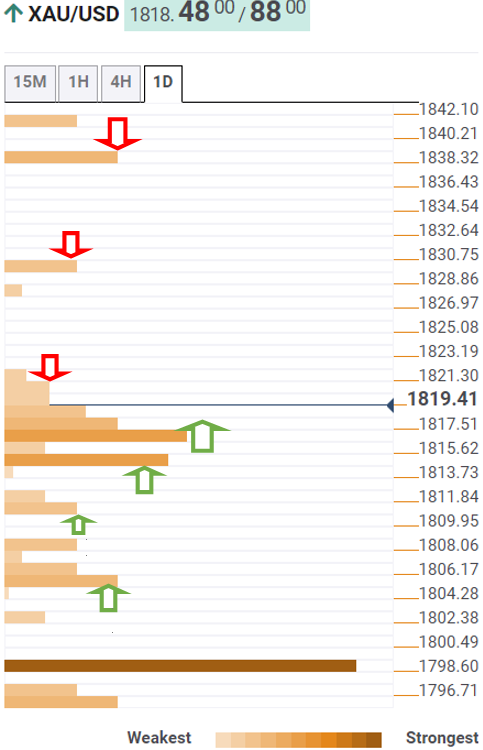
The Technical Confluences Detector shows that gold is challenging the previous high one-hour at $1,821.
On buying resurgence, gold price could see a quick advance towards the pivot point one-day R1 at $1,830.
The next upside barrier is envisioned at $1,834, September highs. A firm break above the latter could open doors towards $1,838, the pivot point one-week R1.
On the flip side, sellers need acceptance below a dense cluster of healthy support levels around $1817 to temporarily negate the upside momentum.
That level is the confluence of the pivot point one-month R1 and the previous low four-hour.
The previous month’s high of $1814 will be next on the bears’ radars. Further south, the Fibonacci 23.6% one-day at $1810 will be targeted.
A breach of the latter will fuel a fresh downswing towards $1805, where the Fibonacci 23.6% one-week coincides with the Fibonacci 38.2% one-day.
Here is how it looks on the tool
About Technical Confluences Detector
The TCD (Technical Confluences Detector) is a tool to locate and point out those price levels where there is a congestion of indicators, moving averages, Fibonacci levels, Pivot Points, etc. If you are a short-term trader, you will find entry points for counter-trend strategies and hunt a few points at a time. If you are a medium-to-long-term trader, this tool will allow you to know in advance the price levels where a medium-to-long-term trend may stop and rest, where to unwind positions, or where to increase your position size.
Author

Dhwani Mehta
FXStreet
Residing in Mumbai (India), Dhwani is a Senior Analyst and Manager of the Asian session at FXStreet. She has over 10 years of experience in analyzing and covering the global financial markets, with specialization in Forex and commodities markets.