Gold Chart of the Week: Bulls not going down without a fight
- Gold bulls run up an impressive gain towards weekly trendline resistance/.
- The focus is on a correction according to the W-formation on the daily chart.

Friday's Nonfarm Payrolls and the hope of a significant fiscal package weighed on US Treasury yields fell, despite the promising US jobs report. The greenback slid also and the combination of the two helped precious metals to rally.
In gold, the bulls ran all the way up to the descending weekly resistance line and towards $1,820. This makes for an interesting technical outlook for the week ahead as follows:
Gold, weekly chart
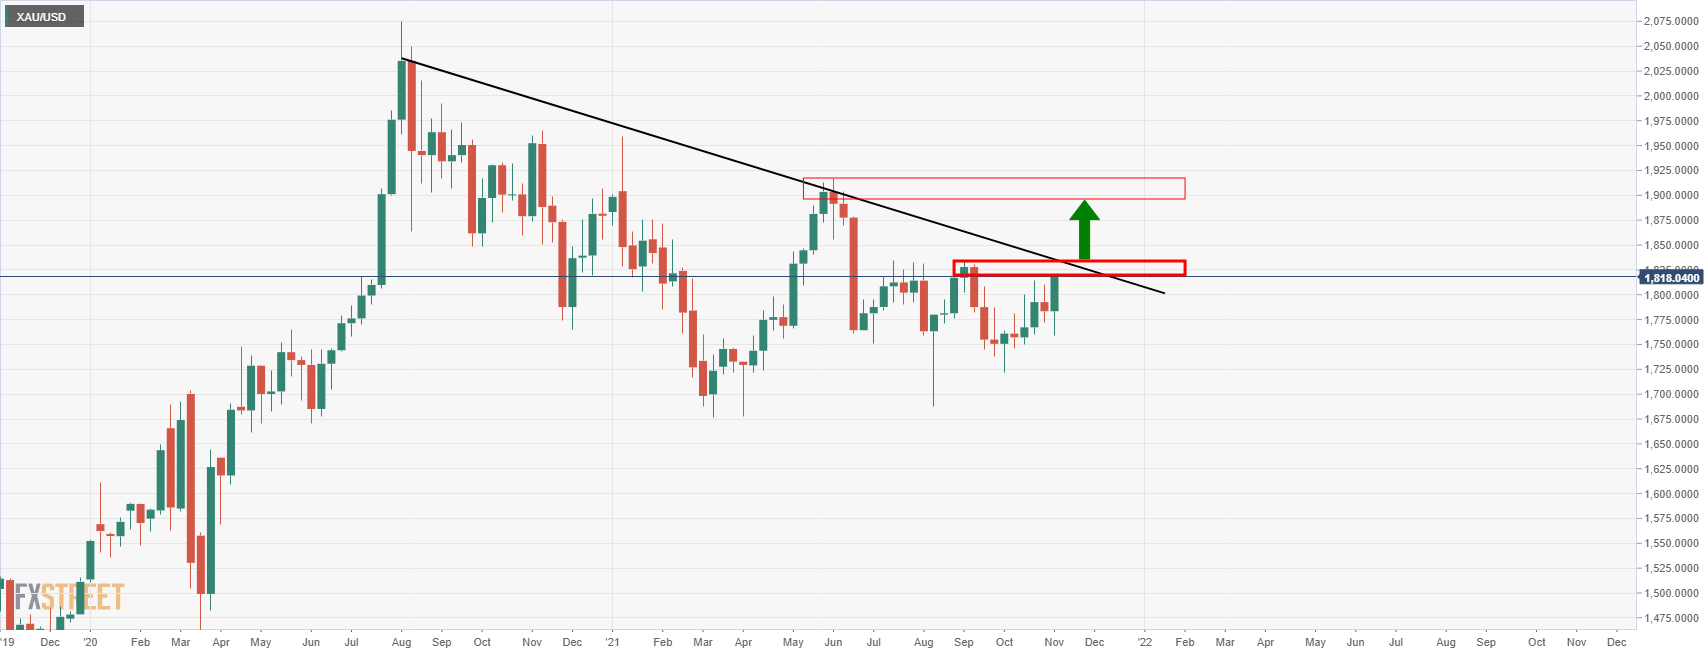
From a weekly perspective, the price is testing territory towards a key horizontal resistance in the 1,830s that guards the trendline resistance slightly higher up. 1,850 will be a line in the sand in this regard for the forthcoming week.
Gold daily chart
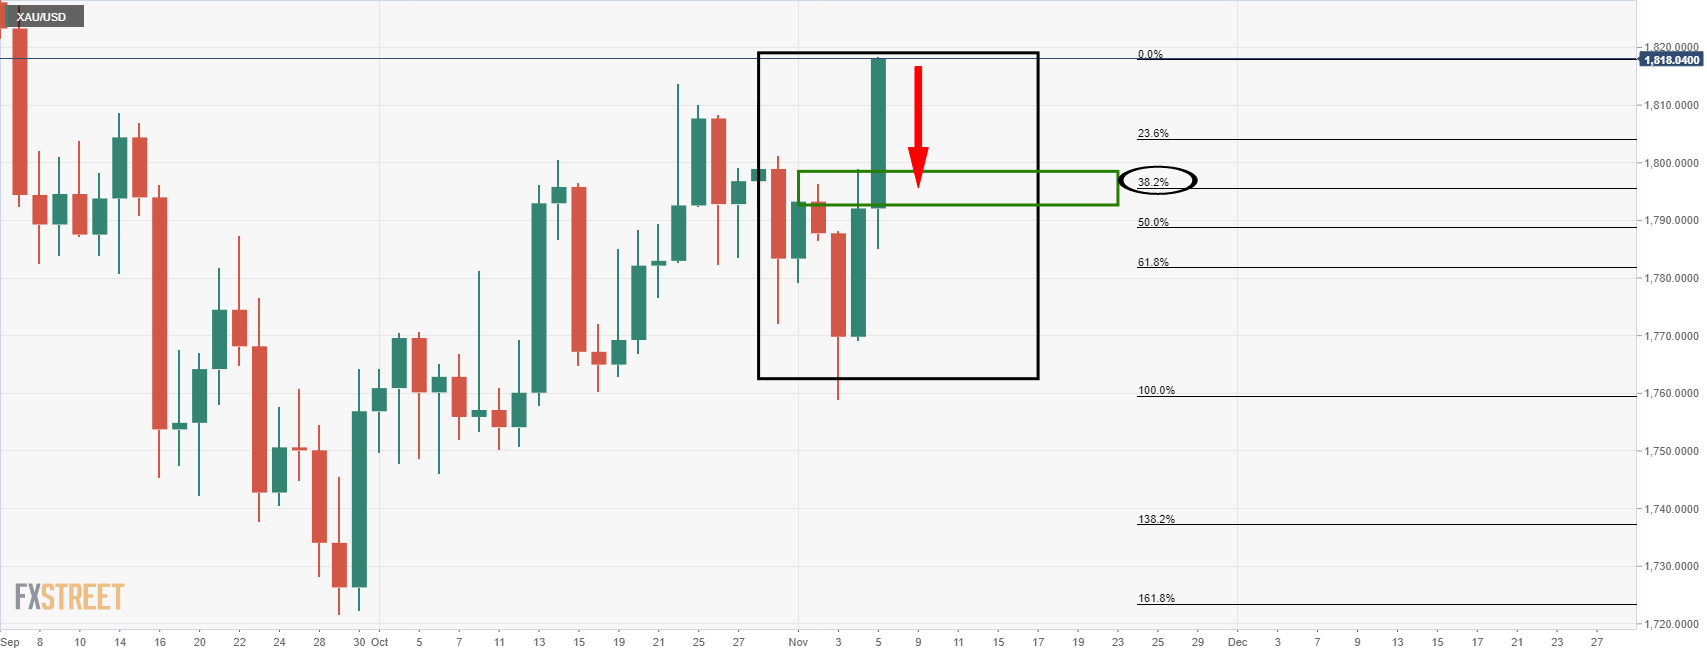
Gold's daily chart is showing a W-formation. A W-formation is a reversion pattern. Considering the imbalance left by the daily rally between 1,770 and 1,818, a correction would be expected for the initial days of the week, targeting the neckline of the W-formation. The neckline meets a 38.2% Fibonacci retracement level near 1,795.
Gold, 4-hour chart
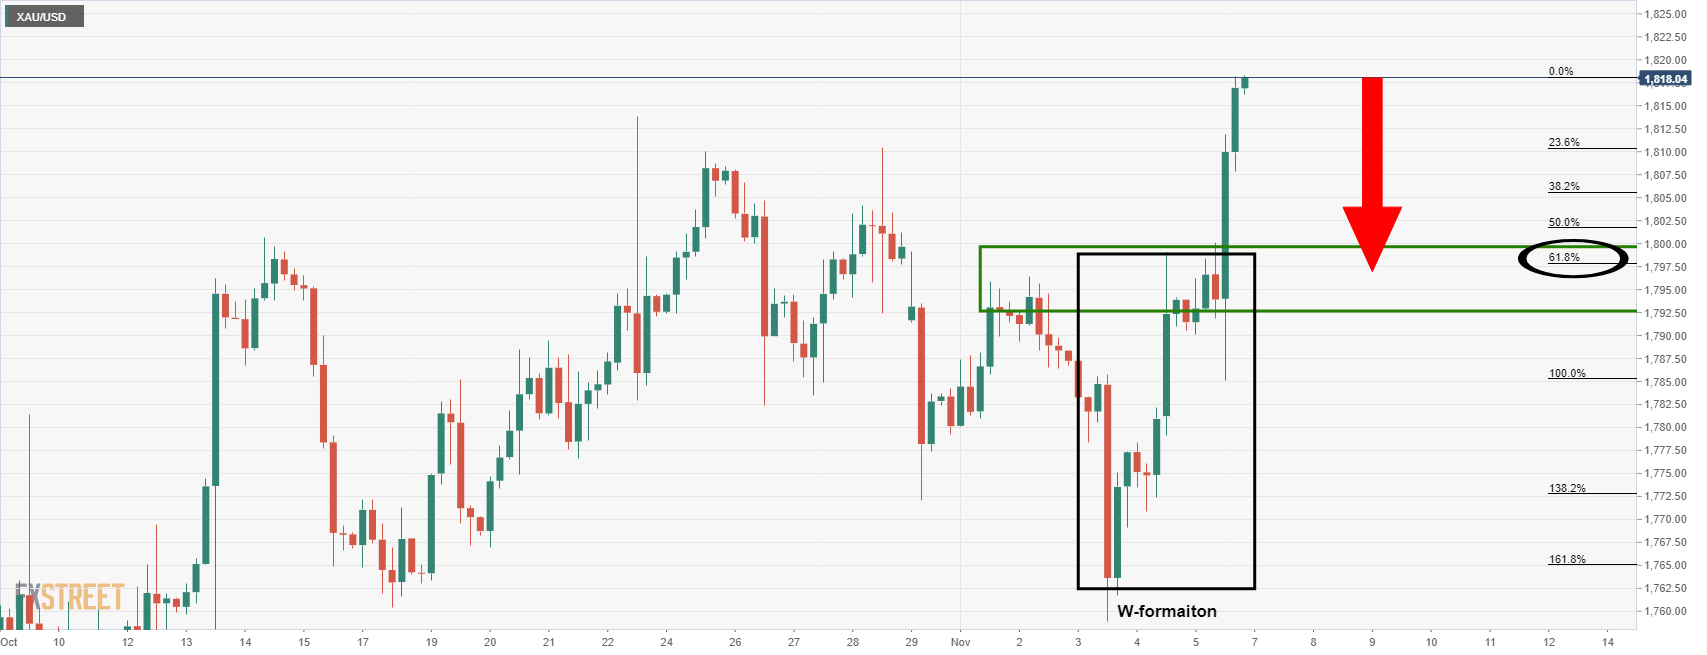
The 4-hour chart shows that there is a 61.8% Fibonacci confluence with the prior resistance that could well come under pressure for the week ahead should there be a significant correction. This comes in near 1,797. It is also noteworthy that the 4-hour W-formation drew in the bears to 1,785 on Friday before the spike to the fresh highs.
Author

Ross J Burland
FXStreet
Ross J Burland, born in England, UK, is a sportsman at heart. He played Rugby and Judo for his county, Kent and the South East of England Rugby team.


