- Gold price keeps the corrective upside intact towards $1,800.
- Omicron covid fears smash the US dollar alongside the Treasury yields.
- Gold looks to extend rebound amid renewed coronavirus fears.
Gold has staged a decent comeback, as bulls look to recapture the $1,800 mark amid a revival of the Omicron covid variant fears. A flight to safety theme remains in vogue, as investors scurry to the US Treasuries, killing the demand for the yields. The sell-off in the US rates have heavily weighed on the dollar, boosting gold’s appeal. However, should risk-aversion intensify the greenback could regain its safe-haven status, capping the gold price recovery.
Read: Gold Price Forecast: Risks remain skewed to the downside for XAU/USD as key support caves in
Gold Price: Key levels to watch
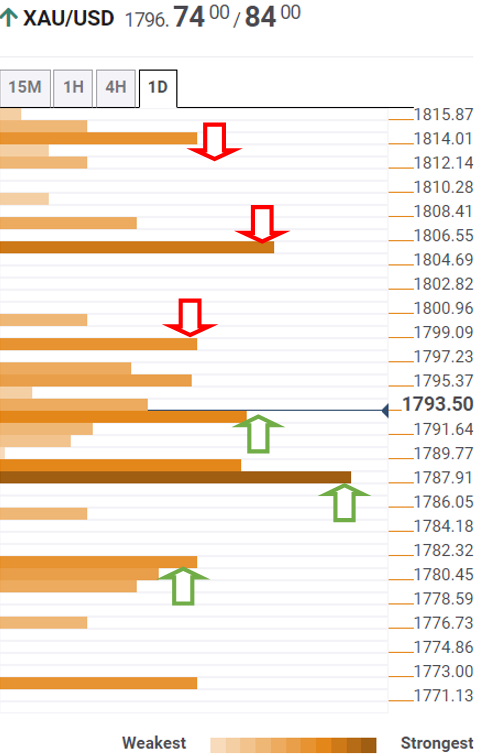
The Technical Confluences Detector shows that the gold price is extending its recovery towards $1,799-$1,800, which is the convergence of the previous day’s high and Fibonacci 23.6% one-month.
The next relevant upside barrier for gold bulls is pegged at 1,806, where the Fibonacci 38.2% one-week lies.
Further up, the pivot point one-day R2 at $1,808 will test the bearish commitment on the road to recovery.
The previous month’s high at $1,814 continues to remain on the buyers’ radars.
On the flip side, the immediate downside seems guarded by a dense cluster of healthy support levels around $1,793.
At that point, the Fibonacci 61.8% one-day coincides with the SMA50 one-day and SMA200 one-day.
The next critical cushion is seen at $1,789, which is a confluence of the Fibonacci 38.2% one-day and SMA5 one-day. Floors will then open up towards Friday’s low of $1,780.55.
Here is how it looks on the tool
About Technical Confluences Detector
The TCD (Technical Confluences Detector) is a tool to locate and point out those price levels where there is a congestion of indicators, moving averages, Fibonacci levels, Pivot Points, etc. If you are a short-term trader, you will find entry points for counter-trend strategies and hunt a few points at a time. If you are a medium-to-long-term trader, this tool will allow you to know in advance the price levels where a medium-to-long-term trend may stop and rest, where to unwind positions, or where to increase your position size.
Information on these pages contains forward-looking statements that involve risks and uncertainties. Markets and instruments profiled on this page are for informational purposes only and should not in any way come across as a recommendation to buy or sell in these assets. You should do your own thorough research before making any investment decisions. FXStreet does not in any way guarantee that this information is free from mistakes, errors, or material misstatements. It also does not guarantee that this information is of a timely nature. Investing in Open Markets involves a great deal of risk, including the loss of all or a portion of your investment, as well as emotional distress. All risks, losses and costs associated with investing, including total loss of principal, are your responsibility. The views and opinions expressed in this article are those of the authors and do not necessarily reflect the official policy or position of FXStreet nor its advertisers. The author will not be held responsible for information that is found at the end of links posted on this page.
If not otherwise explicitly mentioned in the body of the article, at the time of writing, the author has no position in any stock mentioned in this article and no business relationship with any company mentioned. The author has not received compensation for writing this article, other than from FXStreet.
FXStreet and the author do not provide personalized recommendations. The author makes no representations as to the accuracy, completeness, or suitability of this information. FXStreet and the author will not be liable for any errors, omissions or any losses, injuries or damages arising from this information and its display or use. Errors and omissions excepted.
The author and FXStreet are not registered investment advisors and nothing in this article is intended to be investment advice.
Recommended content
Editors’ Picks
EUR/USD stays below 1.0800 after upbeat US data
EUR/USD stays under bearish pressure and trades slightly below 1.0800 in the American session on Thursday. The data from the US showed that the real GDP growth for the fourth quarter got revised higher to 3.4% from 3.2%, supporting the USD and weighing on the pair.
GBP/USD stays in daily range above 1.2600
GBP/USD fluctuates in a narrow channel above 1.2600 on Thursday. The better-than-expected Initial Jobless Claims data from the US and the upward revision to the Q4 GDP growth helps the USD stay resilient against its rivals and limits the pair's upside.
Gold clings to strong daily gains above $2,200
Gold retreats from daily highs but holds comfortably above $2,200 in the American session on Friday. The benchmark 10-year US Treasury bond yield stays above 4.2% after upbeat US data and makes it difficult for XAU/USD to preserve its bullish momentum.
XRP price falls to $0.60 support as Ripple ruling doesn’t help Coinbase lawsuit against SEC
XRP programmatic sales ruling by Judge Torres was completely rejected by another US Court that ruled in favor of the SEC in a lawsuit against Coinbase.
Portfolio rebalancing and reflation trades emerge into Q2
Yesterday’s price action pointed at a possible end-of-quarter portfolio rebalancing as the session saw the laggards of the quarter like Apple and Tesla gain, and the stars like Microsoft and Nvidia retreat.