Gold Price Forecast: XAU/USD remains depressed near $1,825 area ahead of US CPI
- Gold snaps four-day uptrend, reverses from two-month high.
- Market sentiment worsens as reflation fears escalate ahead of US CPI.
- China, stimulus headlines add to the risk-off mood.
- Gold Price Forecast: Looking to extend its rally beyond September high

Update: Gold met with some fresh supply near the $1,832-34 resistance zone on Wednesday and eroded a major part of the previous day's gains to the highest level since early September. The XAU/USD was last seen hovering around the $1,826-25 region, down nearly 0.40% for the day, as the focus remains glued to the latest US consumer inflation figures.
Ahead of the important release, prospects for an early policy tightening by the Fed pushed the US Treasury bond yields higher. This, in turn, was seen as a key factor that drove flows away from the non-yielding yellow metal. Meanwhile, rebounding US bond yields helped revive the US dollar demand, which further acted as a headwind for dollar-denominated commodities, including gold.
That said, the risk-off impulse in the markets extended some support to traditional safe-haven assets and helped limit losses for gold, at least for the time being. Investors also seemed reluctant to place aggressive bets, rather preferred to wait for a fresh catalyst from the US CPI report. The data will influence expectations about the Fed's next policy move and provide a fresh directional impetus to the precious metal.
Previous update: Gold (XAU/USD) takes offers to refresh intraday low near $1,825, flashing the first daily loss in a week heading into Wednesday’s European session. In doing so, the yellow metal steps back from a two-month high and fails to cross the multi-month-old resistance line successfully ahead of the key inflation data from the US.
Fears concerning inflation, worries emanating from China and doubts over the US stimulus underpin the rush to the risk-safety, which in turn helps the greenback and weigh on the gold prices.
Fed Chair Jerome Powell’s failure to placate rate hike bets, backed by the strong US inflation expectations, precede hawkish comments from St. Louis Federal Reserve (Fed) President James Bullard to highlight the latest reflation fears. Fed’s Bullard spoke to CNBC early in Asia to convey expectations of the US central bank to hike its benchmark rate twice in 2022, after it’s finished with winding down its bond-buying program.
On a different page, a 50% slump in share prices of China’s real estate player Fantasia Group after a month-long trading halt and Evergrande’s upcoming coupon payment joins strong inflation numbers from Beijing to weigh on the risk appetite.
Against this backdrop, S&P 500 Futures decline 0.40% whereas the US 10-year Treasury yields consolidate the previous day’s losses around the six-week low near 1.46%.
Looking forward, inflation numbers from the US will be the key catalyst for short-term gold moves. Should the price pressure remain elevated, the USD strength could keep the quote directed towards the south.
Read: US October CPI preview: Inflation data unlikely to discourage gold bulls
Technical analysis
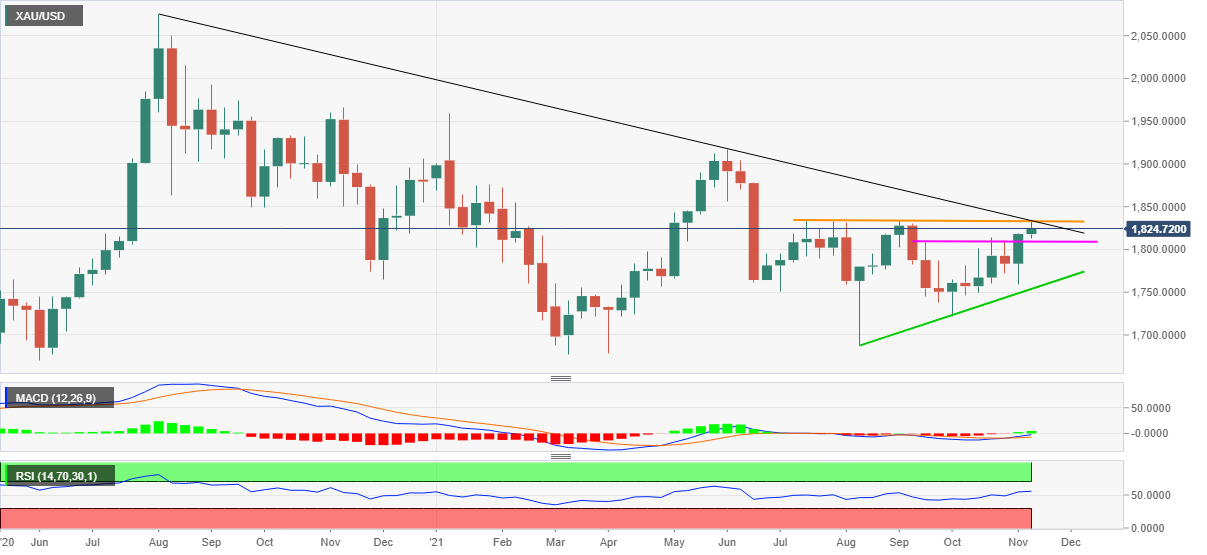
Gold keeps the upside break of a two-month-old horizontal hurdle (pink), now support, while easing from a descending resistance line from August 2020 (black).
Although MACD signals favor buyers, the RSI line needs more fuel as the metal inches closer to a 15-month-old resistance line near $1,832, not to forget the key $1,834-35 resistance line (orange) that defeated bulls twice since July.
Hence, a weekly closing beyond $1,835 becomes necessary for the gold prices to rise further towards early June’s high near $1,857-58 and then to the $1,900 threshold.
A failure to do so could trigger a pullback targeting the resistance-turned-support from mid-September, near $1,808-10.
It should be noted, however, that an ascending trend line from August (green) near $1,750, will challenge the gold bears afterward.
Gold: Weekly chart
Trend: Pullback expected
Author

Anil Panchal
FXStreet
Anil Panchal has nearly 15 years of experience in tracking financial markets. With a keen interest in macroeconomics, Anil aptly tracks global news/updates and stays well-informed about the global financial moves and their implications.


