US October CPI preview: Inflation data unlikely to discourage gold bulls
- Annual Core CPI in US is expected to remain unchanged at 4% in October.
- CPI data is unlikely to alter the Fed's inflation outlook.
- Gold's technical outlook points to additional gains in the near term.

The US Bureau of Labor Statistics will release the Consumer Price Index (CPI) data on Wednesday, November 10. Investors expect the CPI to edge lower to 5.3% on a yearly basis from 5.4% in September and see the Core CPI, which excludes volatile food and energy prices, staying unchanged at 4%.
The Federal Reserve uses the Core Personal Consumption Expenditures (PCE) Price Index as its preferred gauge of inflation and the market reaction to the CPI data is likely to remain muted.
Additionally, Fed policymakers still expect price pressures to ease in the second half of the year and the November CPI report is unlikely to alter the Fed's inflation outlook.
While speaking at the press conference following the November policy meeting, FOMC Chairman Jerome Powell reiterated that the high inflation they are witnessing is caused by supply bottlenecks and strong demand. Powell further noted that they see inflation retreating toward their 2% goal as the economy adjusts next year. On a similar note, US Treasury Secretary Janet Yellen said that she expects price increase to normalize in the second half of next year.
Gold outlook
Earlier in the year, gold prices were impacted by the CPI data due to the sharp fluctuations witnessed in the US Treasury bond yields. The steady increase in inflation caused investors to start pricing a sooner-than-expected policy tightening and provided a boost to the benchmark 10-year US Treasury bond yield. During that period, XAU/USD and the 10-year T-bond yield showed a strong inverse correlation.
Following the decision to start reducing asset purchases by $15 billion per month from November, however, the Fed emphasized that they won't automatically hike the policy rate once the quantitative easing program is concluded. FOMC policymakers want to see further improvement before considering a rate increase and the US central bank's data-dependent stance caused the 10-year US T-bond yield to drop below 1.5%. Gold capitalized on falling yields and rose nearly 2% last week.
Unless the CPI data surpass the market consensus by a wide margin and trigger a leg higher in US T-bond yields, gold's bullish outlook is likely to remain intact.
Technical analysis
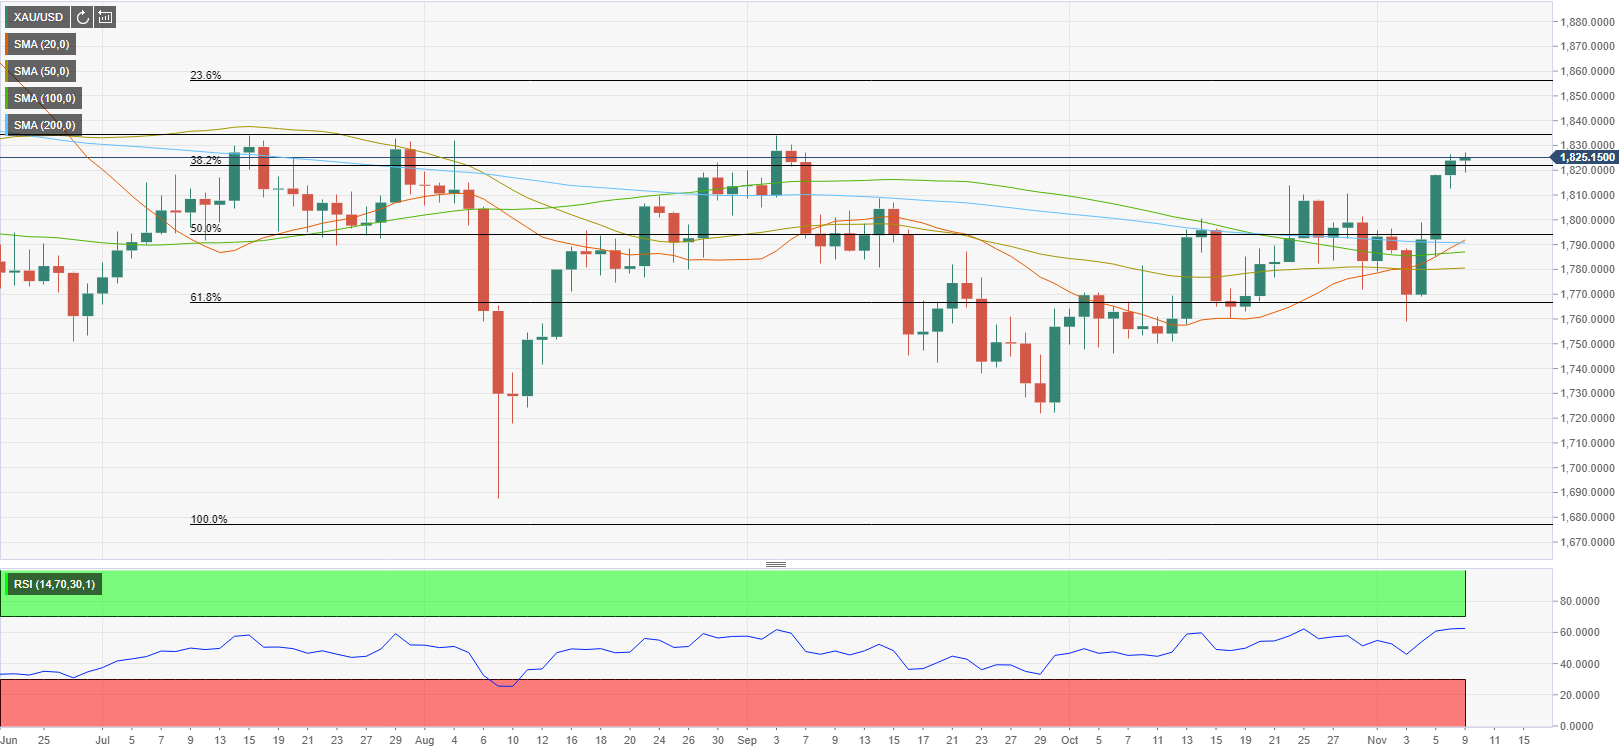
With the sharp upsurge witnessed in the second half of the previous week, gold broke above several key resistances. Following Monday's action, the 20-day SMA climbed above the 200-day SMA, confirming the bullish shift. Additionally, the Relative Strength Index (RSI) indicator on the daily chart is holding near 60, suggesting that there is more room on the upside before XAU/USD becomes technically overbought.
The next target is located at $1,835 (static resistance). A daily close above that level could open the door for additional gains toward the $1,850 area, where the Fibonacci 23.6% retracement of the April-June uptrend is located.
On the other hand, gold could retreat towards the $1,800/$1,790 area (100-day SMA, 200-day SMA psychological level, Fibonacci 50% retracement) in case sellers drag the price below $1,820 (Fibonacci 38.2% retracement) and hold it there.
Premium
You have reached your limit of 3 free articles for this month.
Start your subscription and get access to all our original articles.
Author

Eren Sengezer
FXStreet
As an economist at heart, Eren Sengezer specializes in the assessment of the short-term and long-term impacts of macroeconomic data, central bank policies and political developments on financial assets.