|

Gold Price Forecast: Looking to extend its rally beyond September high

XAU/USD Current price:  $1,828.85

  • Inflationary pressures in the US spurred risk-off movements among equities.
  • Investors are now waiting for the October US Consumer Price Index.
  • XAU/USD has room to test September high at 1,833.95 and even extend its gains.
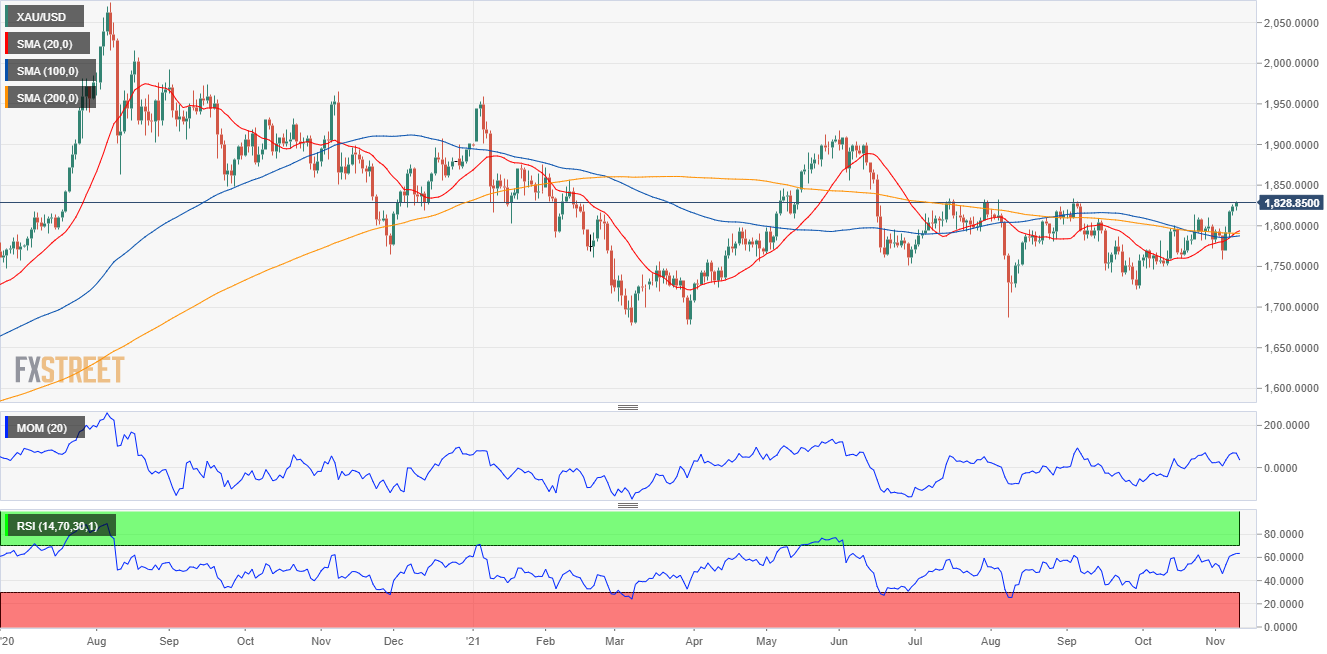
Gold approached September high, hitting $1,830.36 a troy ounce with Wall Street opening, holding on to modest intraday gains. The American dollar started the day with a tepid tone but recovered its poise as the US session developed.  Persistently high inflation in the country has spurred risk-aversion, with Wall Street trading in the red. However, US government bond yields remain subdued, trading at the lower end of their weekly range.

According to official figures, wholesale prices in the US rose 8.6% YoY in October, unchanged from the previous month, yet still advancing at its highest pace in a decade. The core annual reading was confirmed at 6.8%. Concerns about higher prices were exacerbated by comments from St. Louis Federal Reserve Bank President James Bullard, who said that inflation appears to be broader than is sometimes depicted. On Wednesday, the US will publish the October Consumer Price Index, expected to be confirmed at 5.3% YoY.

Gold price short-term technical outlook

Renewed demand for the dollar is having a limited impact on safe-haven gold. XAU/USD daily chart indicates that bulls retain control, as the bright metal keeps posting higher highs and higher lows. The metal develops above all of its moving averages, with the 20 SMA aiming to cross above the longer ones. Technical indicators have lost their bullish momentum, although there are no signs the rally is over.

The 4-hour chart shows that the risk remains skewed to the upside. The RSI indicator remains steady at 72 without indicating bullish exhaustion, while the Momentum indicator also consolidates within positive levels. Also, the 20 SMA maintains a firmly bullish slope below the current level and above the longer moving averages.

Support levels: 1,819.20 1,810.40 1,798.50

Resistance levels: 1,833.95 1,844.30 1,854.40

View Live Chart for the XAU/USD

Author

Valeria Bednarik

Valeria Bednarik was born and lives in Buenos Aires, Argentina. Her passion for math and numbers pushed her into studying economics in her younger years.


More from Valeria Bednarik
Share:

Editor's Picks

AUD/USD sits at two-month lows near 0.6950 after Australian CPI data

AUD/USD is sitting at two-month lows near 0.6950 in the Asian session on Wednesday, as below-expectations August Australian underlying CPI data pours cold water on expectations for further RBA interest rate hikes. Chinese PMI data also fail to inspire the Australian Dollar, despite a pause in the US Dollar advance.

USD/JPY stays weak below 157.00 amid Japanese intervention risks

USD/JPY keeps losses below 157.00 in the Asian session on Wednesday, as hawkish BoJ expectations, along with intervention risks, underpin the Japanese Yen, countering dismal domestic factory output and retail sales data. Meanwhile, a broad US Dollar retreat also collaborates to the pair's downside.

Gold flat lines below $4,200 as traders await US PCE data for Fed rate cues

Gold extends its consolidative price move heading into the European session, trading below the $4,200 mark amid mixed fundamental cues. Falling US bond yields drag the US Dollar away from the two-month high, touched on Tuesday, and act as a tailwind for the commodity. However, hawkish US Federal Reserve expectations cap the upside as traders await important US macro data before placing fresh directional bets on the non-yielding bullion.

Aave Price consolidates below $161 as profit-taking emerges after 10% surge

Aave slips below $161 on Wednesday after surging more than 10% the previous day, with on-chain data suggesting increased profit-taking. Meanwhile, Aave founder Stani Kulechov is considering an AAVE token-burn mechanism under Aavenomics 3.0, adding a potential catalyst for AAVE.

Warning: The RBI's October rate hike may be too late as oil risks mount
The Indian Rupee (INR) is one of the worst-performing Asian currencies in 2026, down about 6.5% year-to-date against the US Dollar (USD) and trading near historic lows ahead of the October 5–7 Reserve Bank of India (RBI) meeting. Economists expect the RBI to raise its repo rate by 25 basis points (bps) next month and follow up with another increase in December to counter rising retail inflation.
Silver is more volatile than Gold ahead of PCE and NFP. This chart shows the positioning gap
The market’s attention is focused on American data this week, but there’s something only those with a trained eye may be looking at: Gold and Silver positioning gap. Financial markets are moving on fears, mostly related to persistently high energy prices driven by the Middle East war. Sure, the US Dollar (USD) is strong, but at what cost?