|

Gold Price Forecast: XAU/USD dribbles within $30 range as Fed Minutes loom

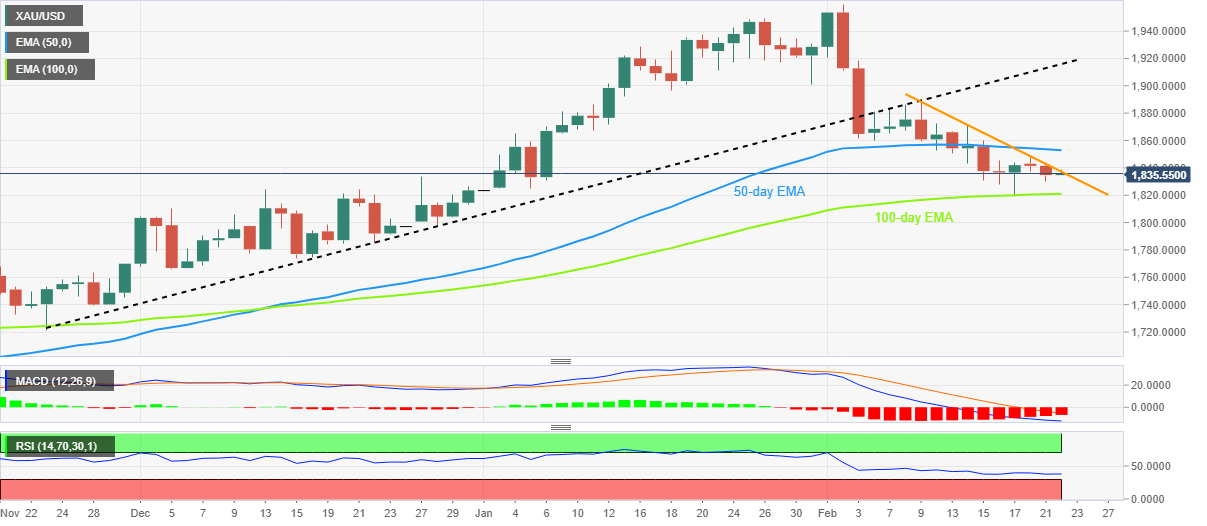
  • Gold price seesaws inside one-week-old trading range between 50-day EMA and 100-day EMA.
  • Cautious mood ahead of FOMC Minutes, geopolitical fears surrounding Russia, China keeps XAU/USD bears hopeful.
  • Fed Minutes should push back policy pivot talks to please Gold sellers.

Gold price (XAU/USD) probes a two-day downtrend as it treads water around $1,835 during early Wednesday. In doing so, the bright metal remains inside the one-week-old trading range of around $30.00 as traders await the Federal Open Market Committee’s (FOMC) Monetary Policy Meeting Minutes. It’s worth noting that the geopolitical fears and the US Dollar’s lackluster moves around the multi-day top seem to add filters to the XAU/USD traders.

That said, firmer prints of the preliminary US S&P Global PMIs for February joined the hawkish Fed bets to underpin the US Dollar Index’s first daily positive in three the previous day, down 0.07% intraday near 104.11 at the latest.

However, the US Treasury bond yields’ lackluster moves around the three-month high, marked the previous day, seem to restrict the XAU/USD momentum of late.

Also likely to probe the Gold traders could be the hawkish bias surrounding the US Federal Reserve (Fed) and looming policy pivot chatters.

Furthermore, comments from US Secretary of State Antony Blinken and Russian President Vladimir Putin weigh on the market sentiment and the Gold price as both suggest further tension between Moscow and Kyiv, which also includes indirect participation of the West and China of late. Though, an absence of major updates in Asia seemed to have paused the risk-off mood.

Amid these plays, the US 10-year and two-year treasury bond yields seesaw around the three-month highs marked the previous day while S&P 500 Futures print mild gains despite Wall Street’s negative closing.

Looking ahead, mixed mood and caution ahead of the FOMC Minutes can keep XAU/USD on a dicey floor but the signals for Fed policy pivot will be enough to recall the Gold buyers.

Gold price technical analysis

Gold price remains inactive between the 100-day Exponential Moving Average (EMA) and 50-day EMA following its break of the three-month-old support line, now resistance. Adding strength to the downside bias are the bearish MACD signals and a two-week-old descending trend line.

It’s worth noting, however, that the nearly oversold conditions of RSI (14) highlight the importance of the 100-day EMA level of $1,821 as the key support.

On the contrary, a downward-sloping resistance line from February 09, close to $1,838 restricts the XAU/USD’s immediate upside ahead of the 50-day EMA, near $1,853 by the press time.

Hence, the Gold price stays on the bear’s radar unless breaking the support-turned-resistance line from late November, close to $1,916, but the room for metal appears limited.

Gold price: Daily chart

Trend: Further downside expected

Additional important levels

Overview
Today last price1836.05
Today Daily Change1.29
Today Daily Change %0.07%
Today daily open1834.76
 
Trends
Daily SMA201881.35
Daily SMA501863.68
Daily SMA1001789
Daily SMA2001776.24
 
Levels
Previous Daily High1843.9
Previous Daily Low1830.3
Previous Weekly High1870.71
Previous Weekly Low1818.93
Previous Monthly High1949.27
Previous Monthly Low1823.76
Daily Fibonacci 38.2%1835.5
Daily Fibonacci 61.8%1838.7
Daily Pivot Point S11828.74
Daily Pivot Point S21822.72
Daily Pivot Point S31815.14
Daily Pivot Point R11842.34
Daily Pivot Point R21849.92
Daily Pivot Point R31855.94

Author

Anil Panchal

Anil Panchal

FXStreet

Anil Panchal has nearly 15 years of experience in tracking financial markets. With a keen interest in macroeconomics, Anil aptly tracks global news/updates and stays well-informed about the global financial moves and their implications.

More from Anil Panchal
Share:

Markets move fast. We move first.

Orange Juice Newsletter brings you expert driven insights - not headlines. Every day on your inbox.

By subscribing you agree to our Terms and conditions.

Editor's Picks

EUR/USD edges higher to mid-1.1600s; looks to US PCE Price Index for fresh impetus

The EUR/USD pair attracts some dip-buyers during the Asian session on Friday and recovers a part of the previous day's retracement slide from the 1.1680 region, or the highest level since October 17. Spot prices currently trade around mid-1.1600s and remain on track to register gains for the second straight week.

GBP/USD: Constructive view prevails above 1.3300 ahead of US PCE inflation data

The GBP/USD pair trades on a flat note near 1.3330 during the Asian trading hours on Friday. Traders prefer to wait on the sidelines ahead of the key US inflation report later on Friday. The US delayed Personal Consumption Expenditures Price Index report for September could offer some hints about the US interest rate path.

Gold edges higher amid dovish Fed expectations; traders await US PCE inflation data

Gold struggles to capitalize on the overnight bounce from the $4,175 area, or the vicinity of the weekly trough, and oscillates in a narrow trading range during the Asian session on Friday. Traders now seem reluctant and opt to move to the sidelines ahead of the September Personal Consumption Expenditures Price Index, or the Federal Reserve's preferred inflation gauge. 

Pi Network: Bearish streak nears critical support trendline

Pi Network edges lower on Friday for the third consecutive day, approaching a local support trendline. The on-chain data suggests an increase in supply pressure as Centralized Exchanges experience a surge in inflows. Technically, the pullback in PI risks further losses, as the Moving Average Convergence Divergence indicator is flashing a sell signal. 

Why the Fed may cut rates in December: Understanding the policy shift

The Fed has gone through a noticeable policy swing in recent months - from initiating a rate cut, to signaling a potential pause, and now shifting once again toward another cut in December. This has created understandable confusion among traders and investors trying to interpret the Fed’s reaction function.

XRP edges lower despite record on-chain activity and steady ETF inflows

Ripple is trading under pressure at the time of writing on Thursday, after bulls failed to break the short-term resistance at $2.22. The reversal may extend toward Monday’s low of $1.98, especially if risk-off sentiment persists in the broader cryptocurrency market.