Gold Price Forecast: XAU/USD corrects to near $1,910 as US Manufacturing PMI comes into spotlight
- Gold price has dropped to near $1,910.00 as Fed Powell is reiterating that two more small interest rate hikes are appropriate.
- The US Dollar Index has strongly rebounded to near 103.20 ahead of the US Manufacturing PMI data.
- Gold price is looking for support near the 61.8% Fibonacci retracement at $1,909.55.

Gold price (XAU/USD) has reported a corrective move to near $1,910.00 in the London session. The precious metal is under pressure as consistent reiteration of more interest rate hikes from the Federal Reserve (Fed) is deepening worries about persistent inflation in the United States economy.
S&P500 futures have posted nominal gains in the London session, portraying further improvement in the risk appetite of the market participants. US equities were also heavily bought on Friday ahead of the quarterly result season.
The US Dollar Index (DXY) has strongly rebounded to near 103.20 as investors are awaiting the release of the US Manufacturing PMI data (June). As per the preliminary report, the economic data is seen higher at 47.2 vs. the former release of 46.9. Investors should note that a figure below 50.0 is considered a contraction and the US factory activities have already contracted straight for seven months.
Gold price is facing pressure despite dovish commentary from Atlanta Fed Bank President Raphael Bostic. Fed Bostic stated last week that the central bank has reached to a point where interest rates are sufficiently restrictive to bring down inflation to 2%.
On the labor market front, US Treasury Secretary Janet Yellen said on Friday that the U.S. economy is on a path to maintain a strong labor market while reducing inflation, even if the economy cools a bit more, as reported by Reuters.
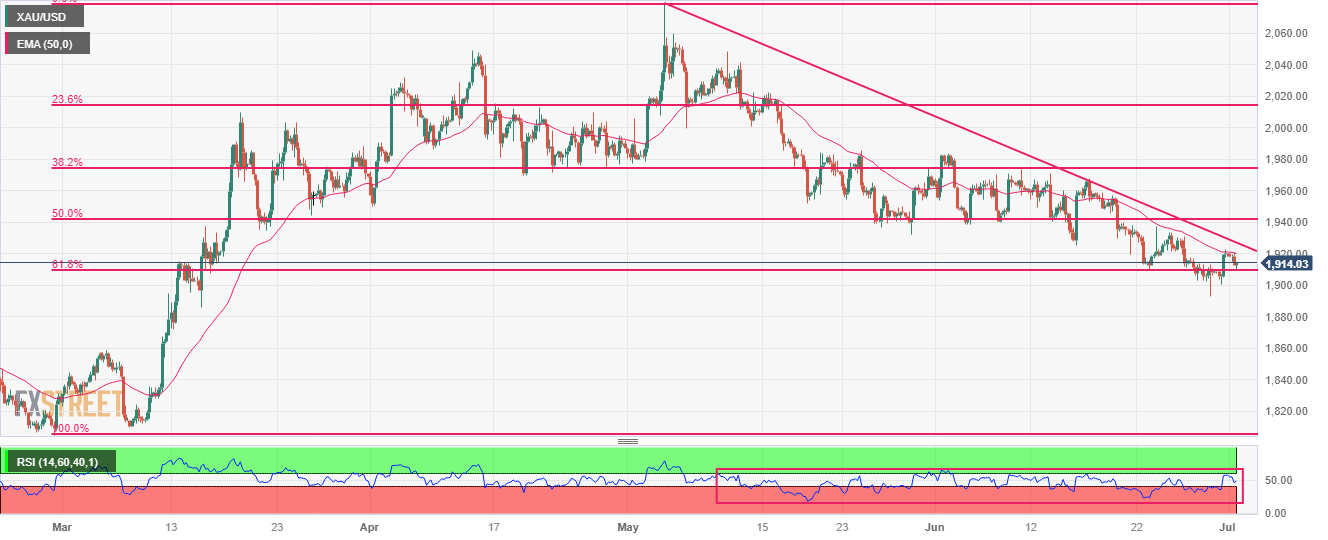
Gold technical analysis
Gold price is looking for support near the 61.8% Fibonacci retracement (plotted from February 28 low at $1,804.76 to May 03 high at $2,079.76) at $1,909.55 on a four-hour scale. The 50-period Exponential Moving Average (EMA) at $1,920.00 is acting as a barricade for the Gold bulls. The downward-sloping trendline from May 03 high at $2,079.76 will continue to remain a barrier for the precious metal.
The Relative Strength Index (RSI) (14) is hovering in the bearish range of 20.00-60.00, which indicates that the downside momentum is active.
Gold four-hour chart
Author

Sagar Dua
FXStreet
Sagar Dua is associated with the financial markets from his college days. Along with pursuing post-graduation in Commerce in 2014, he started his markets training with chart analysis.


