Gold Price Forecast: XAU/USD buyers eye more gains around $1,850 – Confluence Detector
- Gold prices stay firmer around two-month high, pokes yearly resistance line.
- US dollar weakness, softer yields can favor gold buyers amid pre-Fed anxiety.
- Gold Price Forecast: XAU/USD likely to consolidate heading into next week’s FOMC meeting

Gold (XAU/USD) prices reverse the previous day’s pullback from the highest levels since late November during early Friday.
In doing so, the yellow metal cheers consecutive third day of the downbeat US Treasury yields, as well as risk-off mood amid the market’s cautious sentiment ahead of next week’s Federal Open Market Committee (FOMC). The metal cheered the market’s optimism amid mixed US data and China’s rate cut the previous day, not to forget receding fears of the South African covid variant, namely Omicron.
While comments from US Treasury Secretary Janet Yellen triggered the latest risk-off mood, by fueling hawkish Fed concerns, a lack of major data/events may restrict the gold prices during the day. However, fears of the US Fed policymakers’ faster rate hike signals may challenge the precious metal buyers if the US dollar keeps the latest rebound.
Read: Fed Preview: Three ways Powell could out-dove markets, dealing a blow to the dollar
Gold Price: Key levels to watch
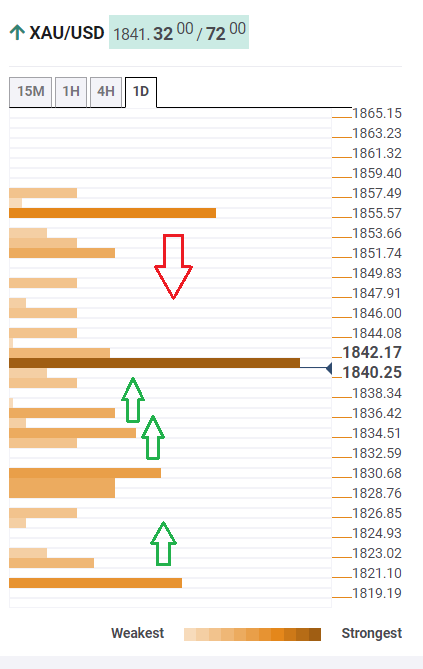
The Technical Confluences Detector shows that the gold price is battling the key hurdle around $1,842 comprising a cluster of SMA10 four-hour, Fibonacci 38.2% one-day and Bollinger Band Upper on the daily formation.
It’s worth noting that the ability to reverse the previous pullback from a multi-day high, as well as staying above key levels, keeps gold buyers hopeful.
Should the bulls get a bit more support from softer USD and yields, they can easily cross the $1,842 hurdle, which in turn will allow them to aim for the $1,856 hurdle comprising Fibonacci 161.8% on one-day and Pivot Point R1 on one month.
During the rise, Pivot Point R2 on weekly may offer an intermediate halt of around $1,852.
Alternatively, if the downside pressure again intensifies, then bears could challenge critical support at $1,831, encompassing the previous month’s high.
Given the gold seller’s ability to conquer the $1,831 support, a downward trajectory towards the $1,821 mark, which is the intersection of the SMA10 one-day and Fibonacci 23.6% one-week, can’t be ruled out.
Here is how it looks on the tool
About Technical Confluences Detector
The TCD (Technical Confluences Detector) is a tool to locate and point out those price levels where there is a congestion of indicators, moving averages, Fibonacci levels, Pivot Points, etc. If you are a short-term trader, you will find entry points for counter-trend strategies and hunt a few points at a time. If you are a medium-to-long-term trader, this tool will allow you to know in advance the price levels where a medium-to-long-term trend may stop and rest, where to unwind positions, or where to increase your position size.
Author

Anil Panchal
FXStreet
Anil Panchal has nearly 15 years of experience in tracking financial markets. With a keen interest in macroeconomics, Anil aptly tracks global news/updates and stays well-informed about the global financial moves and their implications.


