Gold Price Forecast: XAU/USD bulls could emerge ahead of Federal Reserve
- Gold price hourly chart shows that the price is being jammed into the lows of the day.
- Gold price could see a short squeeze for the day ahead as traders get set for the Federal Reserve.

The Gold price has drifted lower for a third day and is testing structure as we head towards key events this week, including the Federal Reserve and the European Central Bank as the key events, the Bank of England and also the United States of America jobs data. The Gold price is down some 0.29% so far having lost territory from a high of $1,934.56 and running into a low of $1,920.74 so far.
The US Dollar and US Treasury bond yields rose ahead of this week's meeting of the Federal Reserve's policy committee. The markets are pricing in a 25 basis point hike but they are also looking for the benchmark rate to peak at 4.93% in June, up from 4.33% now. There are also calls for the central bank to cut it to 4.52% by December.
Gold price depends on US Nonfarm Payrolls and the Federal Reserve
However, if the market is wrong considering how tight the labour market is, then there could be a surge in the US Dollar and that would weigh on the Gold price. On the other hand, a move representing a second consecutive downshift in the Federal Reserve's hiking pace would be deemed positive for the Gold price but the post-meeting communication could still emphasize that the Fed is not done yet in terms of tightening its policy stance. Some Federal Reserve officials have been pushing back against market calls for a pivot and said that they will need to keep rates in restrictive territory for a period of time in order to bring down inflation.
Analysts at Brown Brothers Harriman argued that headline Personal Consumption Expenditure inflation of 5.0% YoY in December is still running more than double the Fed’s 2% target. ''As we’ve said many times before, getting inflation down from 8% to 4% is the easy part; getting it from 4% to 2% is the hard part and that’s what markets continue to miss,'' the analysts argued, adding, 'the Fed needs to continue reminding the markets that the road ahead remains difficult and full of surprises.''
We also get the US Nonfarm Payrolls employment report that likely continued to rise in January, although the expectations of 175k increase in payrolls would not be far off the smallest gain since a drop in December 2020. Nevertheless, the labour market remains tight and layoffs are still very low. However, the Unemployment Rate will be key and the expectation is a rise to 3.6% from 3.5% in December which would be likely damaging to the US Dollar and supportive of the Gold price.
Gold price technical analysis
As per the start of the week's ore-open analysis, a weekly article written before the open each Monday in early Asia, we are seeing the makings of a move lower in Gold price.
Gold price daily chart, pre-open
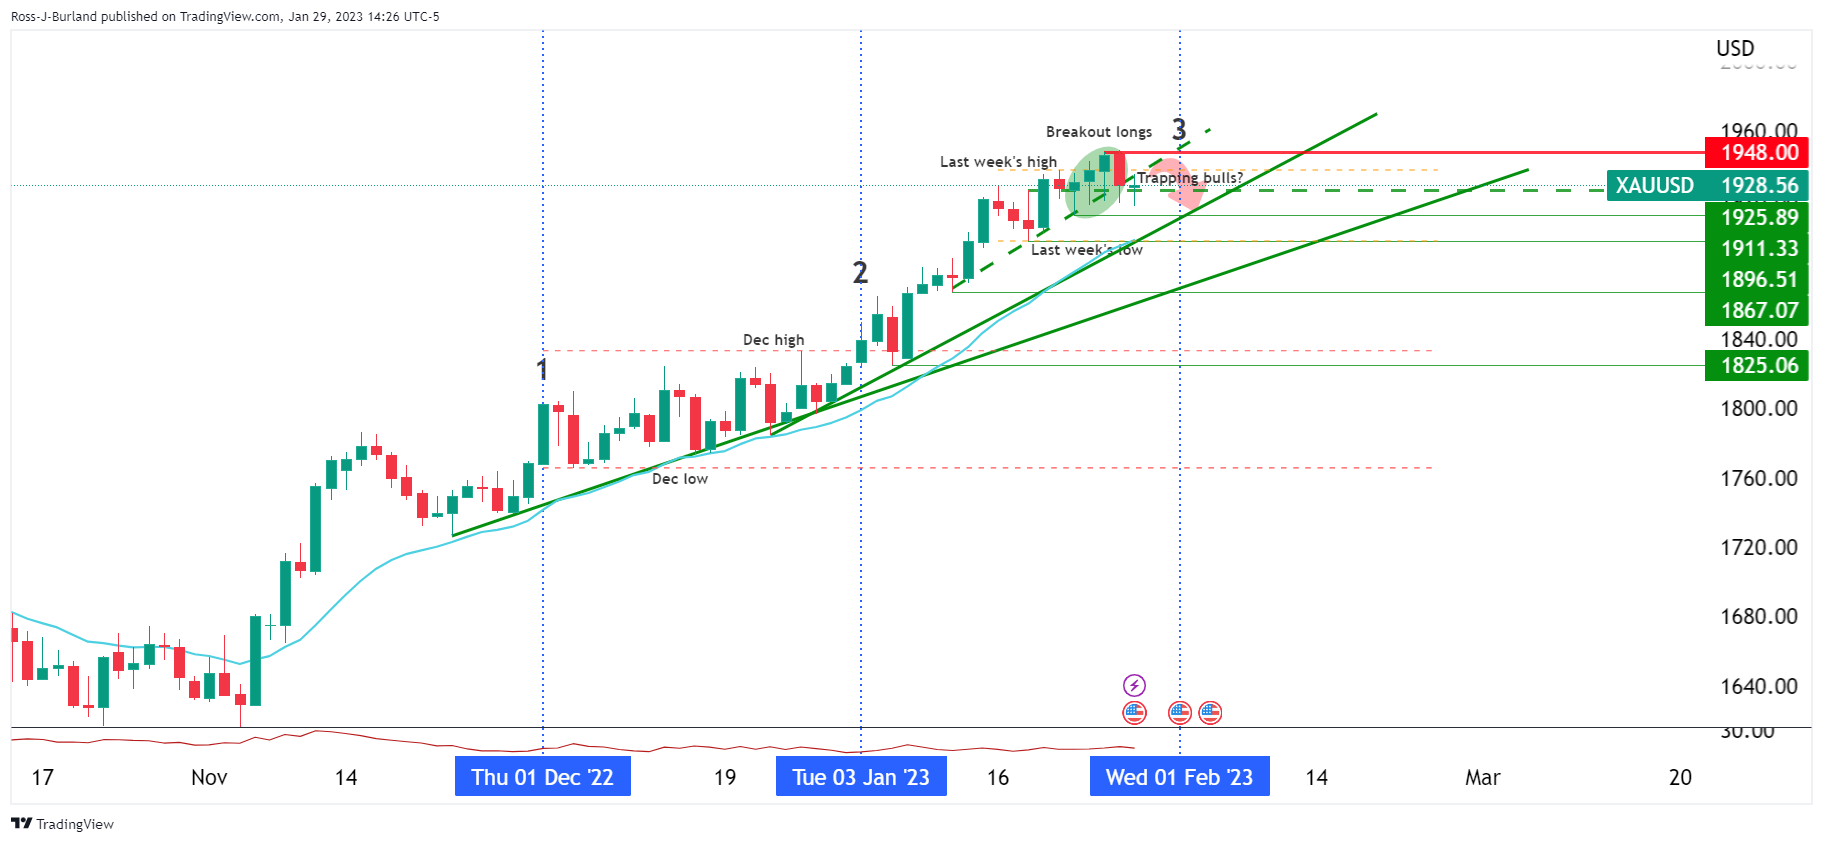
As illustrated, there were a number of compelling features to the Gold price daily chart highlighted in the reopen analysis. There are two positive monthly closes and we could be headed for the third monthly rise this week by the close of January's business having made a fresh high for the cycle last Thursday.
However, we have also made for three weeks of interrupted weekly gains for Gold price and the price action is trapping stubborn bulls:
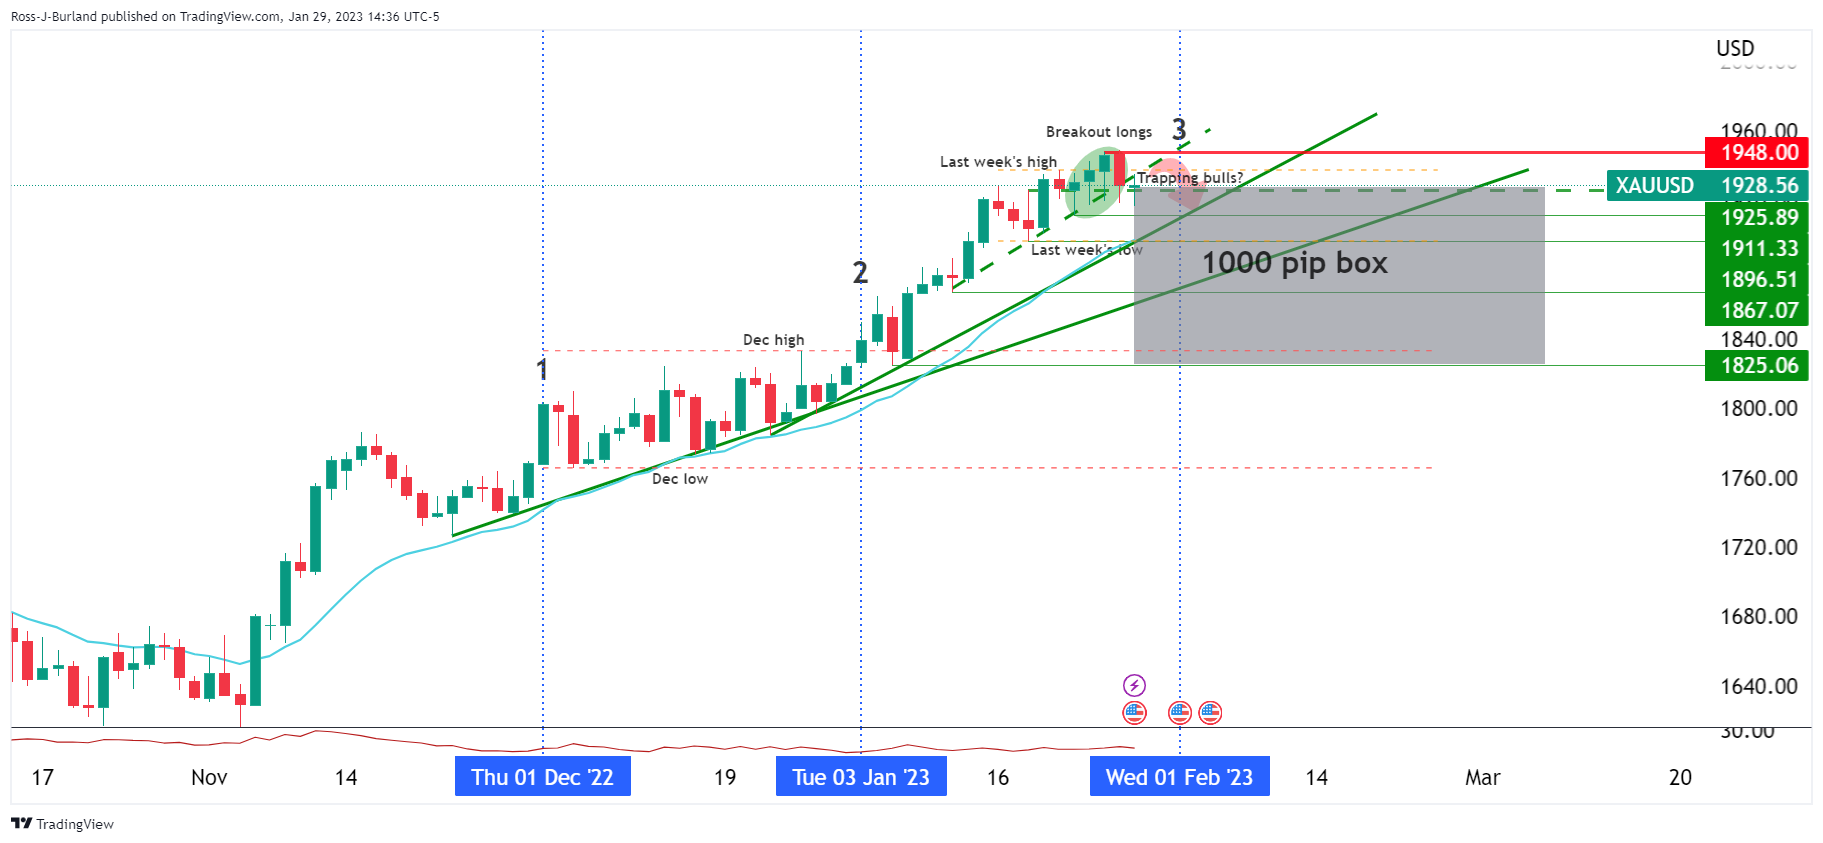
Zooming in we can see that we had a 3-line strike in play for the Gold price:
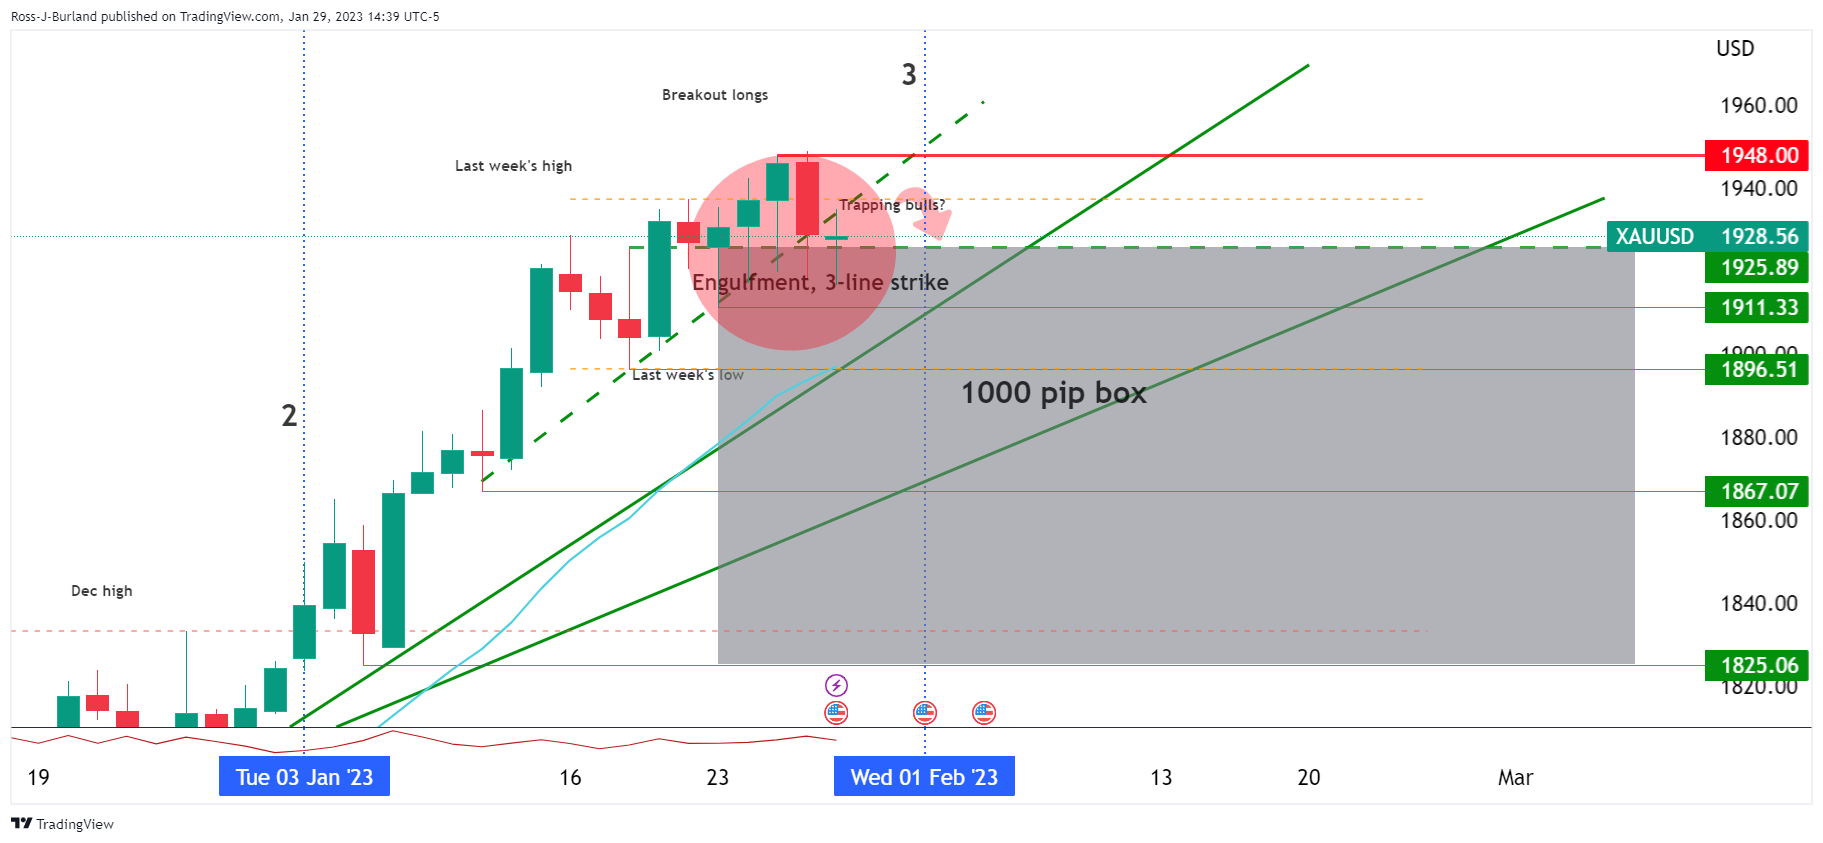
This was a Gold price trend continuation candlestick pattern consisting of four candles. In this particular scenario, we did not have the close below the first of the four candles, but this was a bearish scenario nonetheless for Monday and bears capitalized on it as follows:
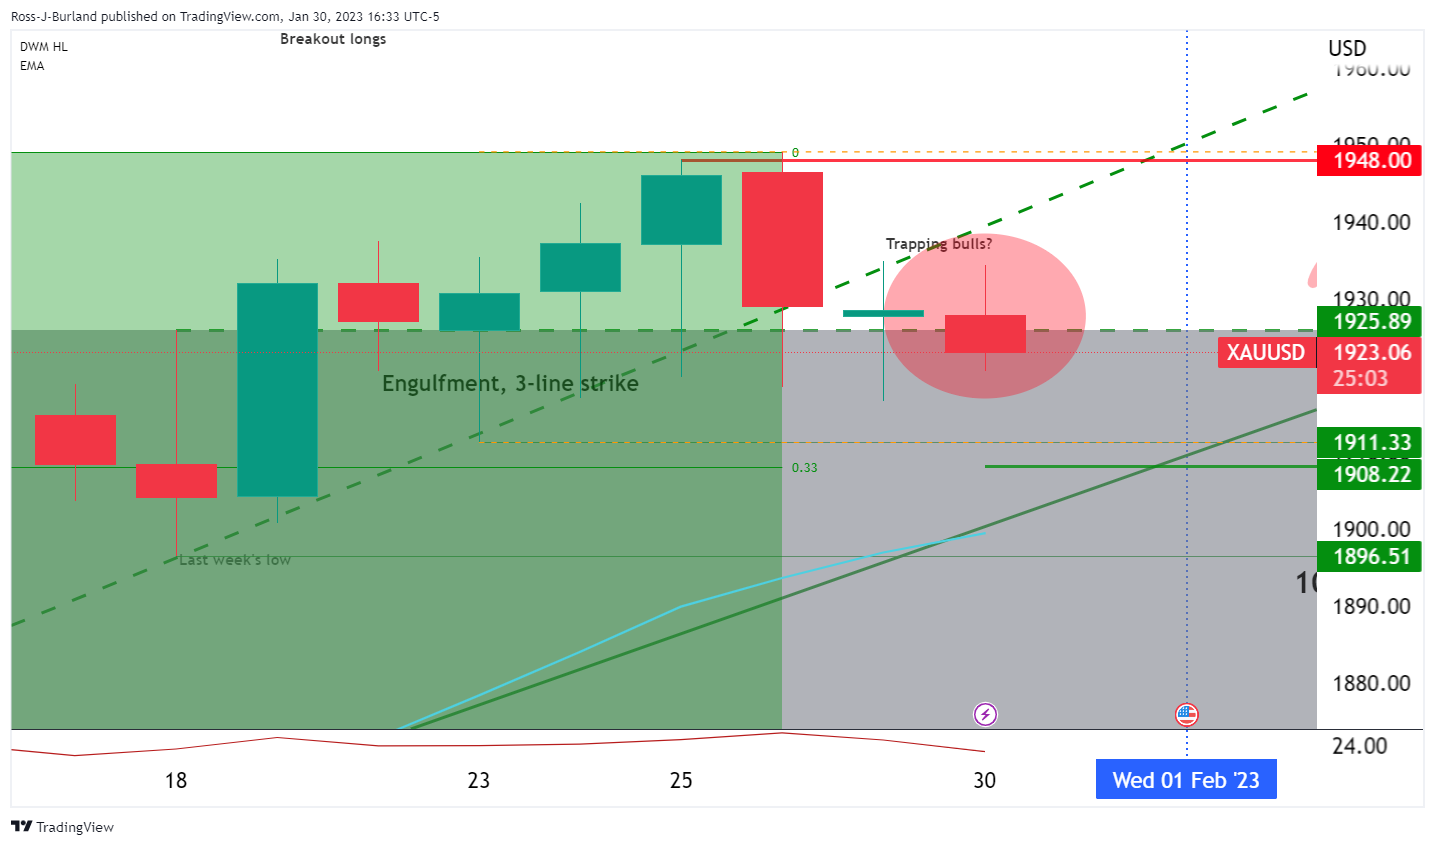
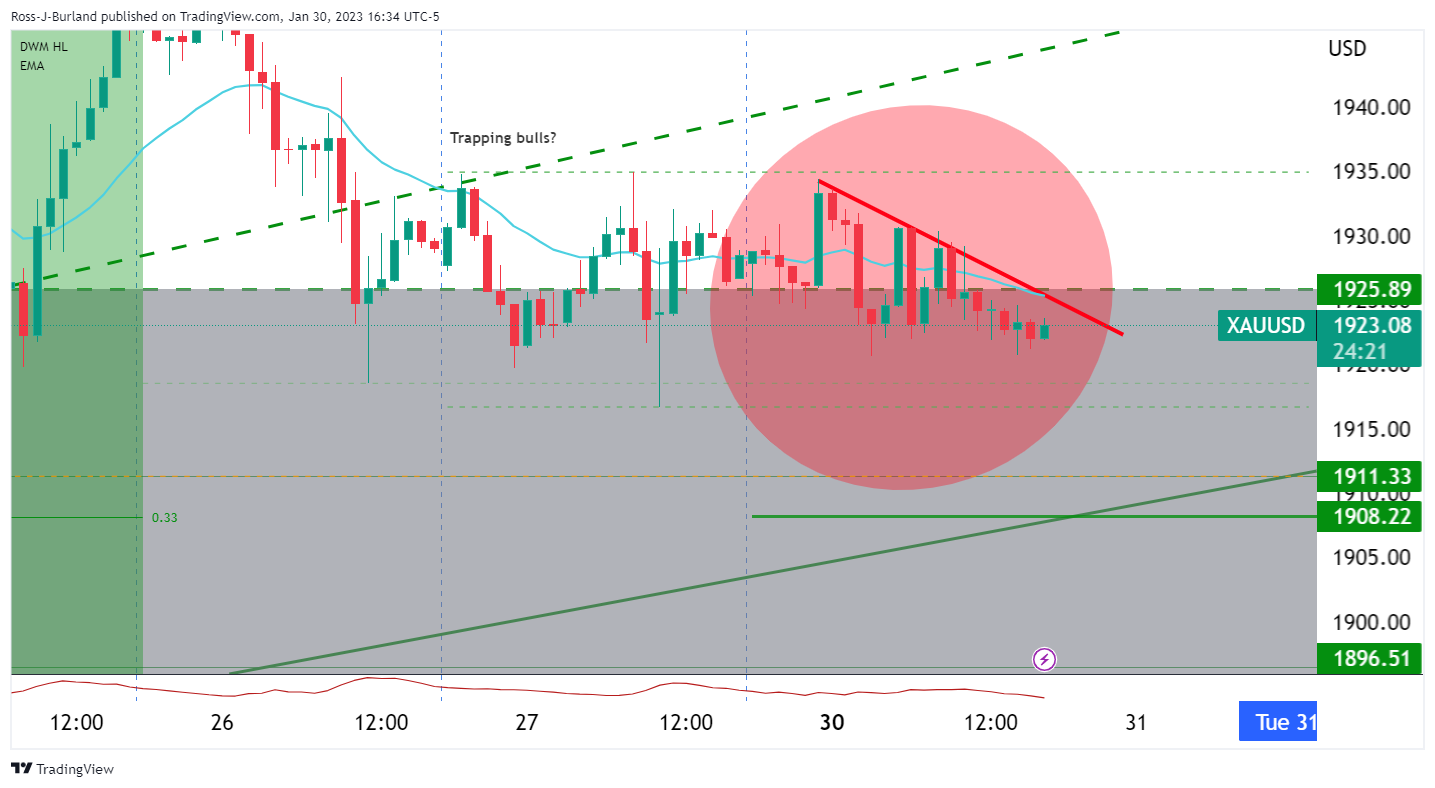
The Gold price hourly chart shows that the Gold price is being jammed into the lows o the day which could open the risk of a squeeze for the day ahead as traders get set for the Fed on Wednesday and ECB on Thursday.
Author

Ross J Burland
FXStreet
Ross J Burland, born in England, UK, is a sportsman at heart. He played Rugby and Judo for his county, Kent and the South East of England Rugby team.
















