Gold Price Forecast: XAU/USD bulls brace for $1,970, focus on Fed, China – Confluence Detector
- Gold Price stays firmer at the highest level in a month amid sluggish start to the week.
- Receding hawkish Fed bias, China stimulus and sustained trading past key support keep XAU/USD buyers hopeful.
- Downbeat yields, cautious optimism in Asia add strength to the Gold Price.
- Sino-American tension, lack of major data/events prod XAU/USD buyers.

Gold Price (XAU/USD) remains on the front foot as bulls prod the early August swing high while keeping the reins past the $1,936-38 support confluence. In doing so, the precious metal cheers the US Dollar’s retreat amid fears about the Federal Reserve’s (Fed) policy pivot, especially after witnessing mostly downbeat figures in the last few days. With this, the US Dollar Index (DXY) snaps a two-day winning streak with mild losses to around 104.15.
Apart from the softer US Dollar, China’s multiple measures to defend the world’s second-largest economy also propelled the XAU/USD price, due to the Dragon Nation’s status as one of the world’s biggest Gold customers. Among the latest actions, the government’s establishment of a special cell to promote the private economy and opening up barriers for the services industry gained major attention. Previously, China's central bank, namely the People's Bank of China (PBoC), announced a heavy cut to its foreign exchange reserve requirement ratio (FX RRR) to 4% from 6.0% effective from September 15. Additionally, a slew of China banks cut interest rates on Yuan deposits to ease the pressure from lower mortgage rates announced previously.
Elsewhere, the downbeat performance of the US Treasury bond yields in the last two weeks also underpin the Gold Price rebound, especially when the XAU/USD stays firmer beyond the key technical support.
Moving on, the holiday-shortened week may test the Gold buyers, together with the US-China tension. However, the US ISM Services PMI and China inflation data, as well as stimulus announcements from Beijing, may entertain the bullion traders.
Also read: Gold Price Forecast: XAU/USD attempts another run to take out 100 DMA at $1,954
Gold Price: Key levels to watch
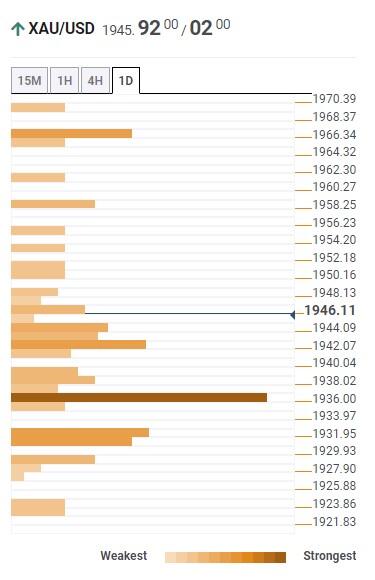
Our Technical Confluence indicator suggests that the Gold Price floats firmly beyond the $1,936-38 support confluence comprising the Fibonacci 61.8% on one-month, 5-DMA and the lower band of the Bollinger on the four-hour (4H) play.
Also restricting the short-term downside of the XAU/USD is the $1,942 level that encompasses the Fibonacci 38.2% on one-day, as well as the middle band of the Bollinger on the hourly and 4H formations.
It’s worth noting, however, that the Gold Price weakness past $1,936 will need validation from $1,932 to convince the sellers. That said, the stated support confluence includes the 50-DMA and Pivot Point one-day S1.
Alternatively, the previous monthly high of around $1,967 appears luring the XAU/USD buyers during the commodity’s further advances. Following that, an area comprising multiple hurdles marked during May and July, around $1,985, will be in the spotlight.
Overall, the Gold Price has fewer barriers toward the north but the US data and China news can test the bulls.
Here is how it looks on the tool
About Technical Confluences Detector
The TCD (Technical Confluences Detector) is a tool to locate and point out those price levels where there is a congestion of indicators, moving averages, Fibonacci levels, Pivot Points, etc. If you are a short-term trader, you will find entry points for counter-trend strategies and hunt a few points at a time. If you are a medium-to-long-term trader, this tool will allow you to know in advance the price levels where a medium-to-long-term trend may stop and rest, where to unwind positions, or where to increase your position size.
Author

Anil Panchal
FXStreet
Anil Panchal has nearly 15 years of experience in tracking financial markets. With a keen interest in macroeconomics, Anil aptly tracks global news/updates and stays well-informed about the global financial moves and their implications.


