Gold Price Forecast: XAU/USD bears in the market, eyes on $1,945
- Gold price is pressured and eyes a key support area.
- Gold price bears will be looking for a break of $1,945.

Gold price was pressured at the start of the week after an initial short squeeze in the open. At the time of writing, Gold price is trading at $1,954 and down by some 0.4% after falling from a high of $1,967.90 to a low of $1,953.47. Attention remains firmly fixed on this week's Federal Open Market Committee meeting and weaker US data suggest the tightening cycle may end this week.
In the data, the US composite flash July PMI eased to 52.0 vs 53.2, service activity fell 2.0pts to 52.4 but manufacturing rose 2.7pts to 49.0. Within the composite index, new orders fell 1.6pts to 51.9.
The services incoming new business index fell 3.0pts to 52.5. Manufacturing new orders rose strongly, gaining 5.8pts to 48.5 but still in contractionary territory. Employment remained above 50.0 signalling ongoing hiring if at a slower pace. Manufacturing employment rose 0.4 to 52.8 but services employment fell 0.4 to 51.0. ''We think the data are consistent with the FOMC pausing rate hikes after raising 25bp this week,'' analysts at ANZ Bank explained. Indeed, the market will be looking to Fed chair Jerome Powell to confirm such a sentiment that when he speaks following the meeting.
Treasury yields rose, bearish for gold since it offers no interest. The US two-year note was last seen paying 4.911%, up 5.2 basis points, while the yield on the 10-year note was up 1.4 basis points to 3.855%. Meanwhile, the US Dollar continues to also benefit from growing divergences. Those divergences are first seen in the economic outlook and this divergence then spreads to monetary policies. The US Dollar looks to be the cleanest shirt in the laundry basket if US data is compared to global data where many economies are tipping into recession.
''Ahead of this week's FOMC meeting, gold bugs have received some support from CTA trend followers near local highs, but prices have failed to rally further,'' analysts at TD Securities explained, adding:
''This may suggest a notable counterparty on the offer that has absorbed the flow, but our gauge of discretionary trader positioning suggests an increase in positioning following the cooling inflation print. This suggests the culprit for recent selling activity following the recent rally may be associated with a physical market participant, this cohort's mean-reverting trading style suggests that gold's inability to rally in the face of CTA buying activity may hold little information about future flows. Still, algos will need prices to break above the $2010/oz mark before a subsequent buying program is catalyzed.''
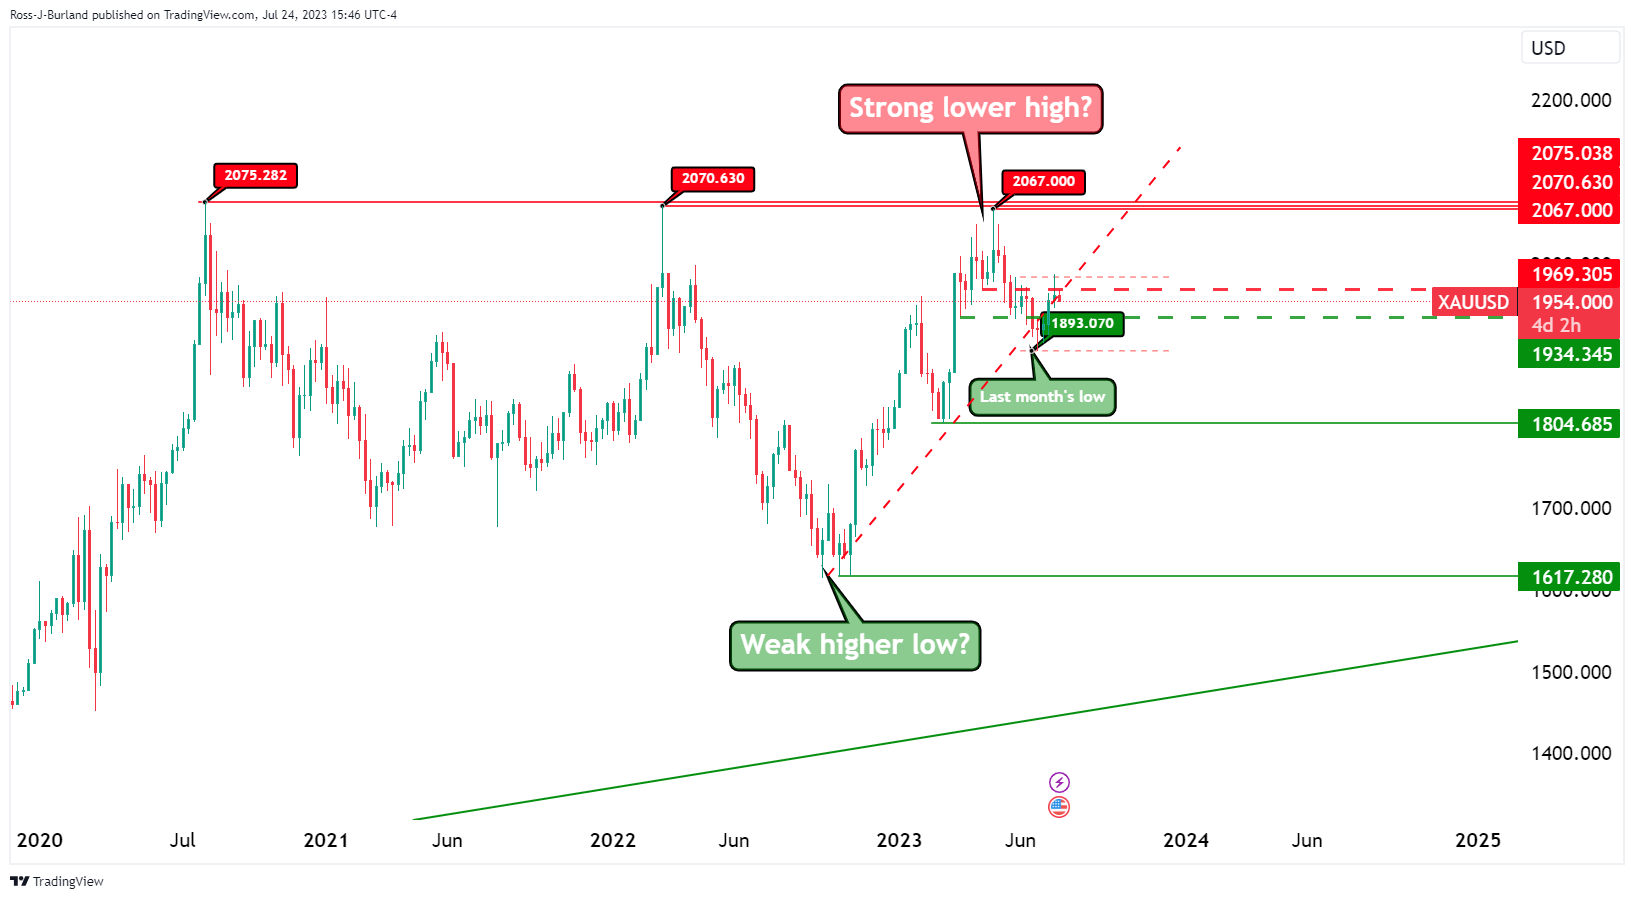
Gold weekly chart
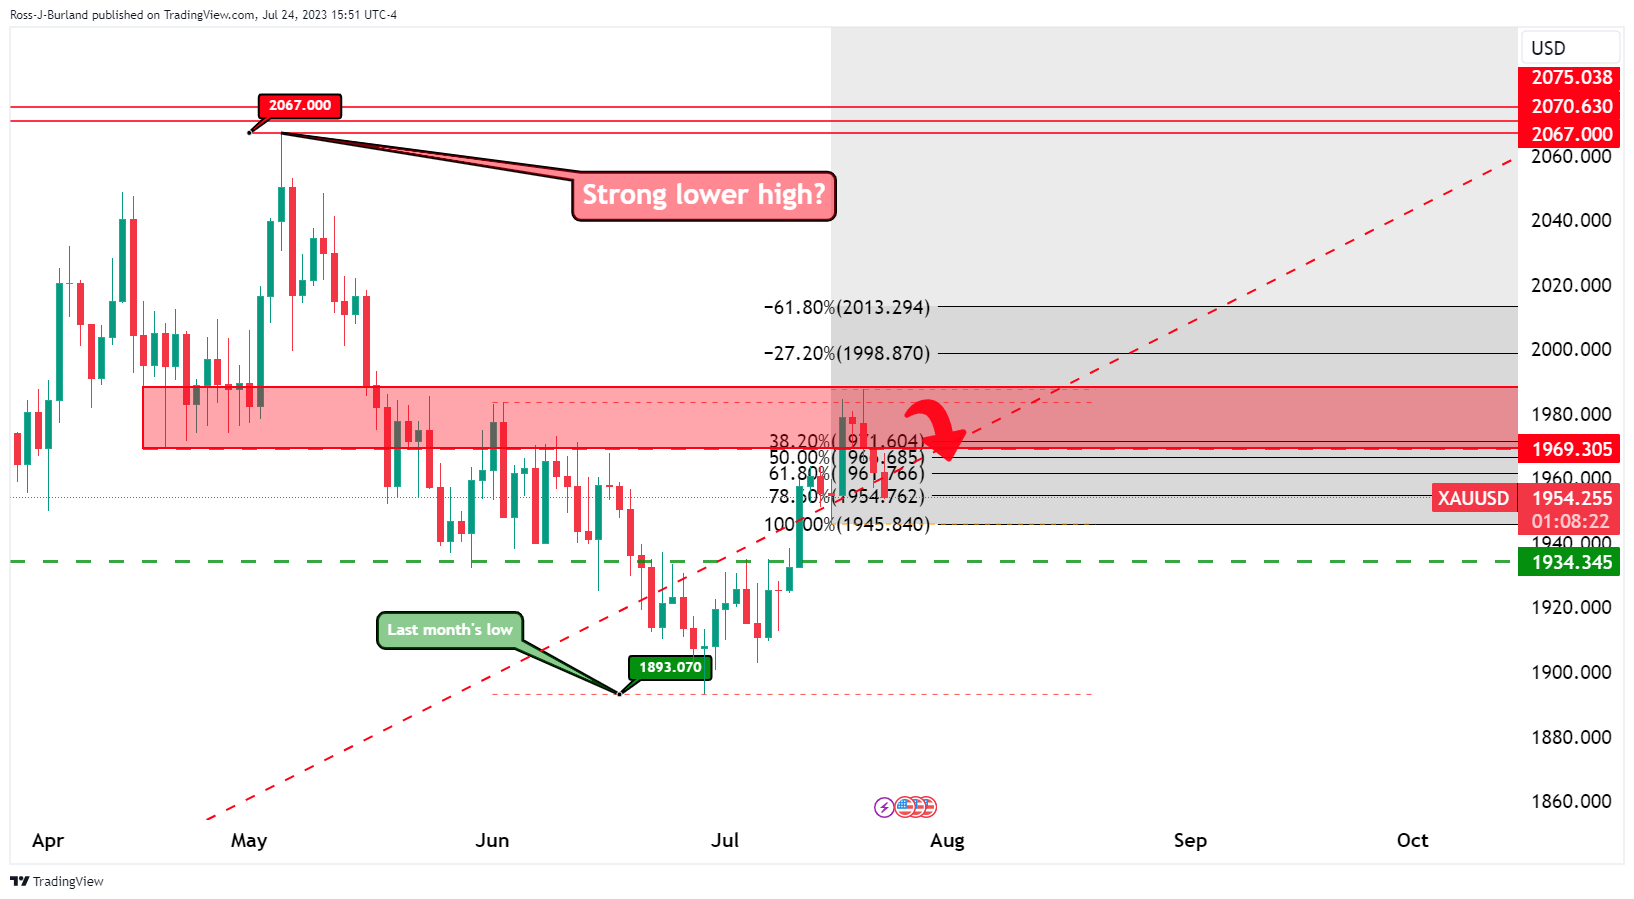
Gold daily charts
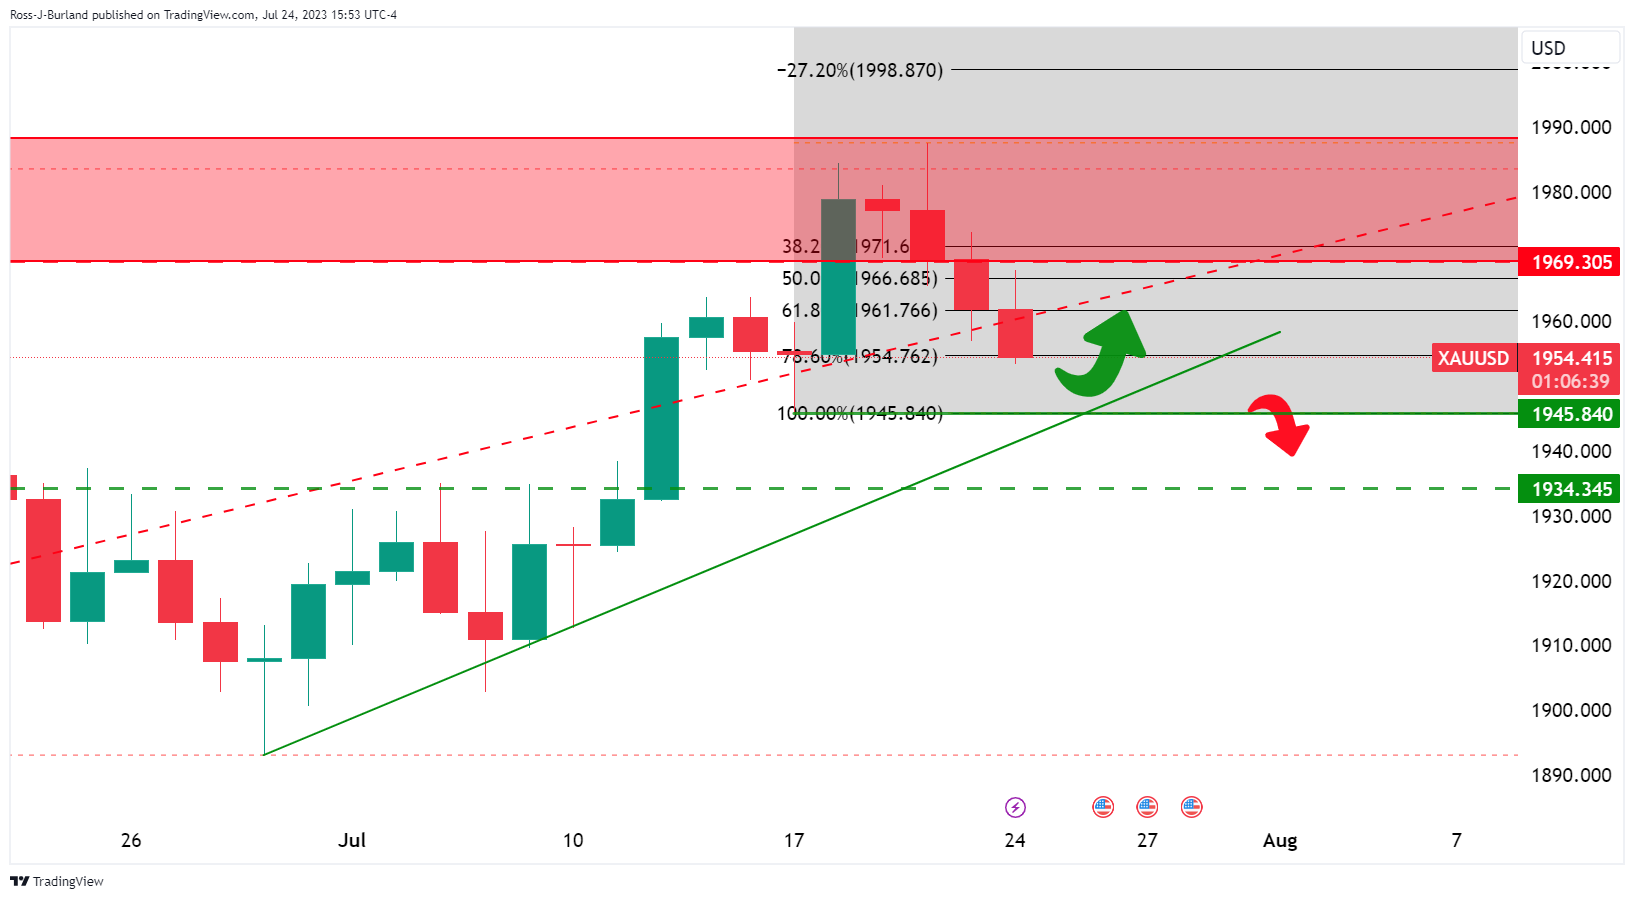
Gold H4 chart
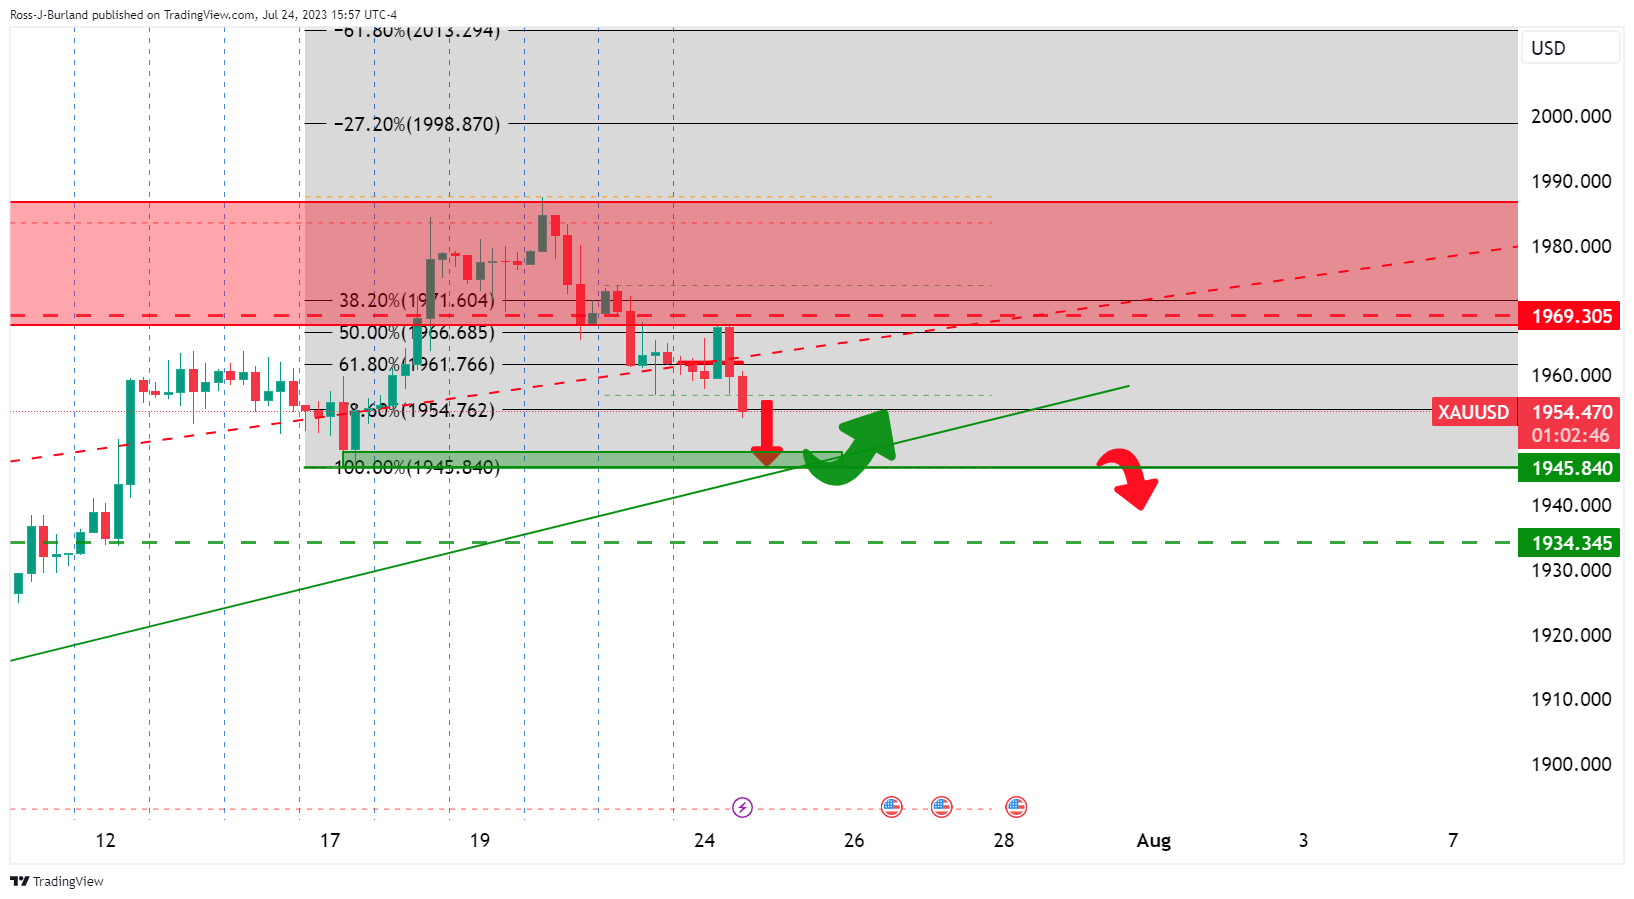
$1,945 is eyed as a key support area and the line in the sand into the FOMC.
Author

Ross J Burland
FXStreet
Ross J Burland, born in England, UK, is a sportsman at heart. He played Rugby and Judo for his county, Kent and the South East of England Rugby team.


