Gold Price Forecast: XAU/USD bears burst the gage as US yields tear higher
- Gold is back under pressure in a resurgence in the US dollar.
- DXY has been as high as 111.735, making gold more expensive for international buyers.
- The yield on the US 10-year note was up a high of to 3.78%, bearish for gold since it offers no interest.

The gold price was down some 0.7% by midday in New York, trading below the highs of the day of $1,727.84 and reaching as low as the psychological $1,700 level. The greenback has caught up with the robustness in US yields which is putting a barrier up against gold's recent resurgence.
The yellow metal broke the $1,700 level at the start of the week as investors started to discount the Fed premium due to poor manufacturing data that was accompanied by a massive miss in the JOLTS data ahead of this week's showdown event in Nonfarm Payrolls. ''With money manager positioning skewed short, the easing of rates and the USD, amid weaker US economic data, sparked a bout of short covering in precious metals,'' analysts at TD Securities said.
US JOLTS
-638005016651390367.png)
US job openings fell to almost 10.1 million in August, according to the Bureau of Labor Statistics, below the consensus on Econoday for 11.15 million and down from 11.17 million reported in July. The larger-than-expected decline could be the first sign that demand for labour is falling. The weaker data has caused traders to bet the Federal Reserve may raise interest rates less than previously expected as the central bank turns more dovish as the US economy slows, offering a tailwind to gold.
However, the analysts at TD Securities said that they expect another beat on this week's NFP on Friday, ''which could present a catalyst for a repricing lower.''
''The pain trade is still to the downside in precious metals, and the latest positioning data highlighted that other reportables started to meaningfully liquidate their gold length, suggesting pressure towards a capitulation in gold is indeed building''
Meanwhile, as illustrated in the following technical analysis, the US dollar index, DXY, was last seen up 1% at 111.20 but it had been as high as 111.735, making gold more expensive for international buyers, while the yield on the US 10-year note was up a high of to 3.78%, bearish for gold since it offers no interest.
Today's data also went some ways in supporting the greenback. The September ISM services index showed significant resilience in the face of rapid Fed tightening since March. ''At 56.7, the index rose for the 28th consecutive month and is more or less in line with the 20-year long-run average (57.5). In sum, service sector activity is not yet sufficiently below trend to exert strong downward pressure on inflation. Indicators of price pressures are slowing. The prices component was 68.7 vs 71.5 and the supplier deliveries index eased 0.6 to 53.9. Employment rebounded to 53.0 (+2.8) and new exports rose (+3.2 to 65.1), despite the strength in the US,'' analysts at ANZ Bank explained.
Gold technical analysis
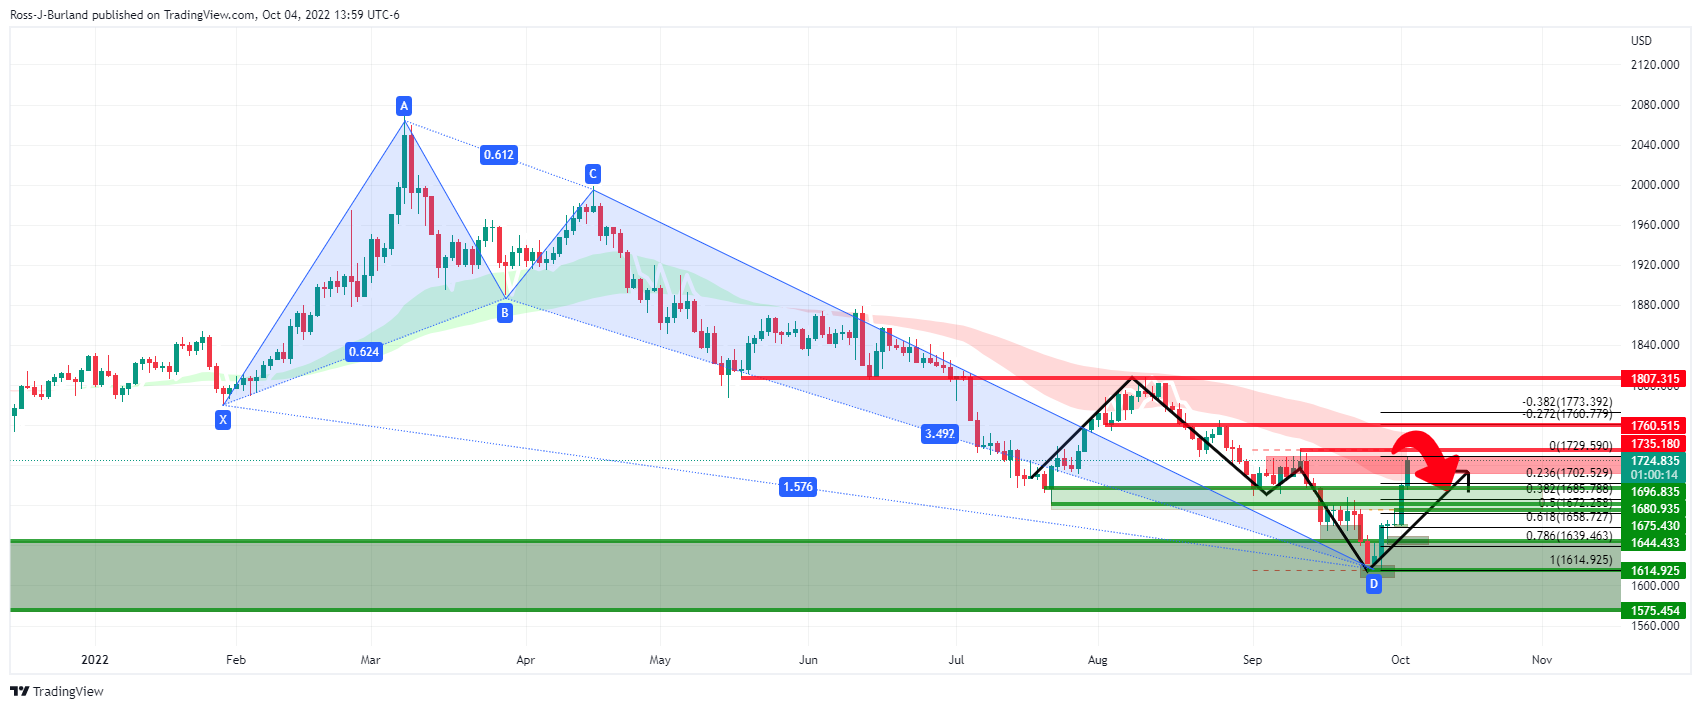
In yesterday's analysis, it was explained that the daily chart had seen the price rejected higher as per the harmonic Crab which is a bullish pattern.
However, the potential resistance as per the weekly M-formation and prior month's highs as well as a 21/50 smoothed moving average cloud were flagged.
It was explained that if this is going to be the highs of the week, then there would be a focus on the downside and that exposes a 50% mean reversion near the $1,685/75 area.
Gold update:
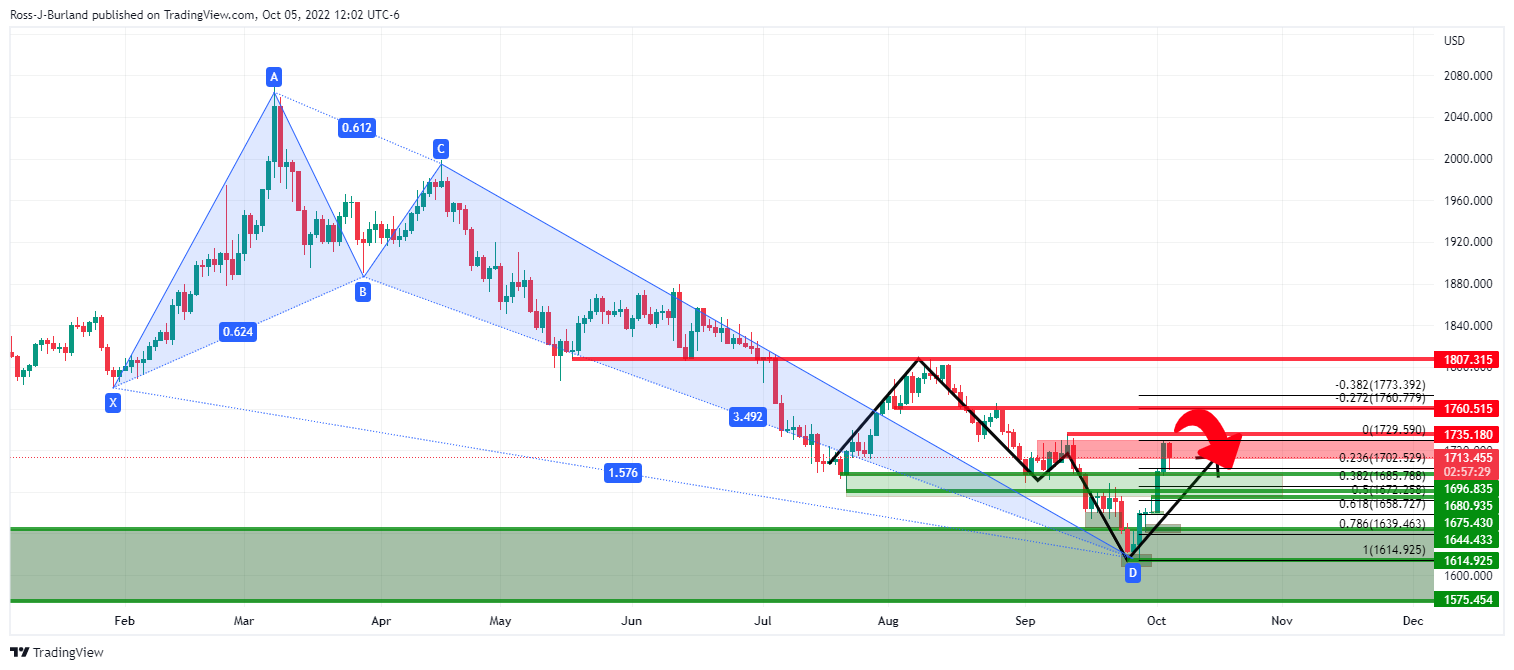
The price has started to correct in what could be the start of the run towards the 50% mean reversion near the $1,685/75 area.
Looking to the 10-year yield, it had been finding support throughout the start of the week and might have been considered a leading indicator of the US dollar's advance:
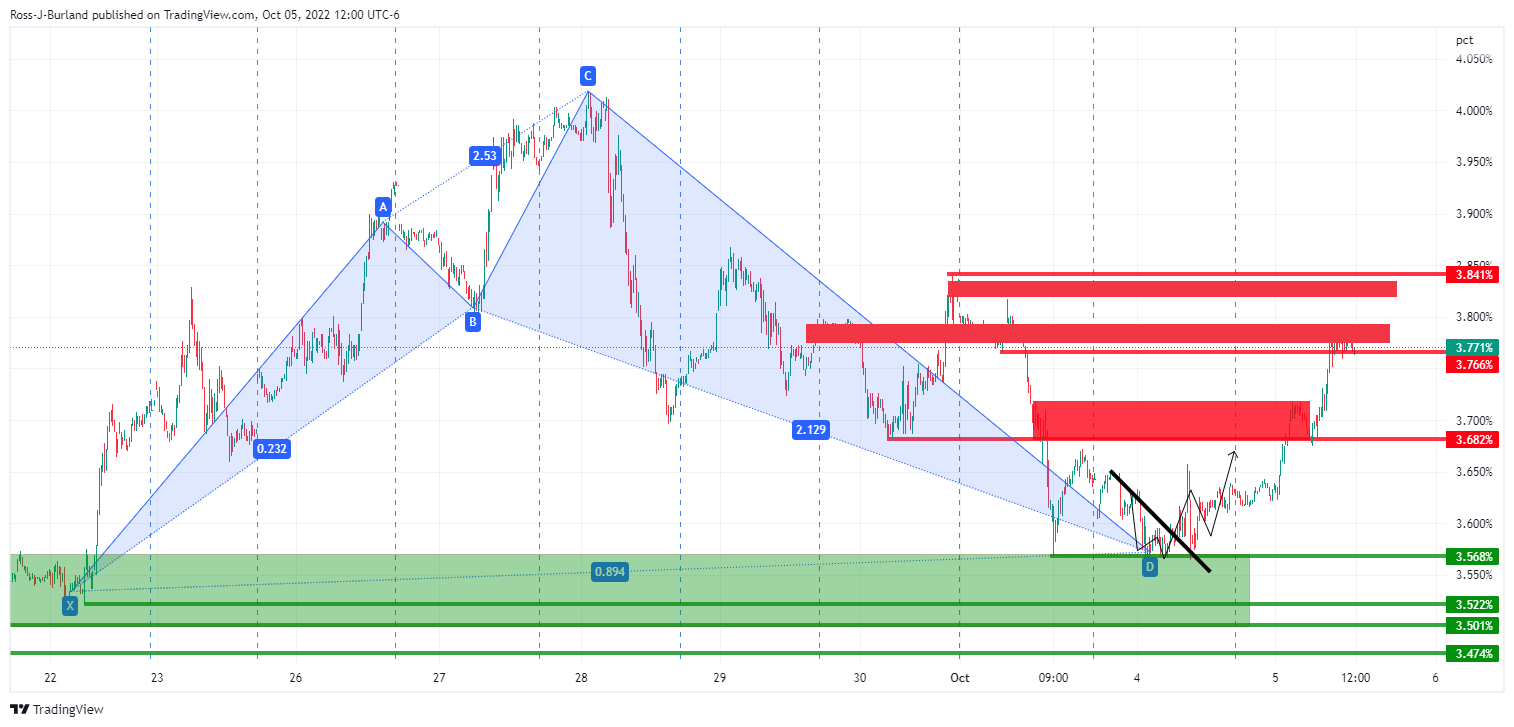
Consequently, the US dollar index, below, is breaking higher and back into line of the harmonic bullish pattern:

Author

Ross J Burland
FXStreet
Ross J Burland, born in England, UK, is a sportsman at heart. He played Rugby and Judo for his county, Kent and the South East of England Rugby team.















