Gold Price Forecast: XAU/USD appears ‘buy the dips’ trade en-route $1,941 – Confluence Detector
- Gold price could retest $1,917 support before running back toward $1,941.
- US Dollar weakness boosts Gold price to fresh nine-month highs near $1,930.
- US markets are closed on Monday, thin trading could exaggerate moves.

Gold price is on track for the third straight day of gains, as bulls hold fort near the highest level in nine months above $1,900 at the start of the week. The ongoing weakness in the US Dollar gathered pace following a fresh USD/JPY sell-off, triggered by hopes of a hawkish Bank of Japan (BoJ) pivot. Further, the US Dollar continues to feel the heat from increased expectations of slower US Federal Reserve (Fed) rate hikes, in the face of easing US Consumer Price Index (CPI). Going forward, heightened volatility could be expected in the Gold price amid a US market holiday and overbought technical conditions. Meanwhile, investors await speeches from the Fed official and the US Retail Sales data due later this week for fresh trading incentives in Gold price.
Gold Price: Key levels to watch
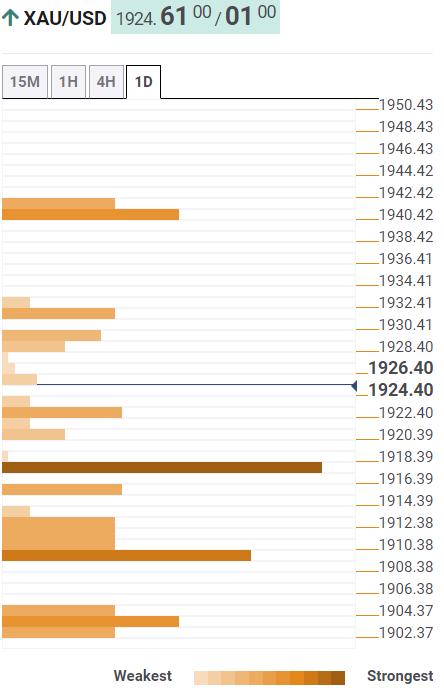
The Technical Confluence Detector shows that the gold price could retest Friday’s high at $1,922 on retracement from multi-month highs. A breach of the latter will put the critical support at $1,917 under threat. That level is the convergence of the pivot point one-month R3 and the previous low four-hour.
The next immediate cushion is seen at the Fibonacci 23.6% one-day $1,915. Deeper declines could challenge bullish commitments near $1,909, where the Fibonacci 23.6% one-week and the Fibonacci 38.2% one-day coincide.
Alternatively, Gold buyers need a sustained move above the intraday high at $1,929 to initiate a fresh upswing toward the pivot point one-day R1 at $1,931.
The next stop for bulls is envisioned directly at $1,941, the confluence of the pivot point one-week R1 and pivot point one-day R2.
Here is how it looks on the tool
About Technical Confluences Detector
The TCD (Technical Confluences Detector) is a tool to locate and point out those price levels where there is a congestion of indicators, moving averages, Fibonacci levels, Pivot Points, etc. If you are a short-term trader, you will find entry points for counter-trend strategies and hunt a few points at a time. If you are a medium-to-long-term trader, this tool will allow you to know in advance the price levels where a medium-to-long-term trend may stop and rest, where to unwind positions, or where to increase your position size.
Author

Dhwani Mehta
FXStreet
Residing in Mumbai (India), Dhwani is a Senior Analyst and Manager of the Asian session at FXStreet. She has over 10 years of experience in analyzing and covering the global financial markets, with specialization in Forex and commodities markets.


