Gold, Chart of the Week: XAU/USD meets $1,920 resistance area, eyes on 4-hour structures to the downside
- Gold price runs into key long-term resistance.
- Bears are on the prowl and eye a break of 4-hour support structure.

Gold kept on giving to the bulls last week following the US Consumer Price Index rally. A strong fresh bull cycle high was put in that has met a milestone of historic structure around $1,920. If there was ever a time for a pullback, it would be here, but before taking up such a position traders will be on the lookout for signs of deceleration, (more on that below).
Meanwhile, speculation that the Federal Reserve may pivot to a dovish policy was further supported by the latest CPI print. However, analysts at TD Securities argued that ''while the precious metal space is no longer in a selling mode, there continues to be correction risk as it is not all certain that inflation has been defeated and that the US central bank is ready to get less restrictive anytime soon.''
Last week, analysts at Brown Brothers Harriman were also of the opinion that the market is underestimating the potential for a higher for longer Federal Reserve. ''Core Personal Consumption Expenditures, PCE, has largely been in a 4.5-5.5% range since November 2021,'' they said. ''We think the Fed needs to see further improvement before even contemplating any sort of pivot.''
The analysts, at the time, noted that the WIRP suggested a 25 bp hike on February 1 was fully priced in, with nearly 30% odds of a larger 50 bp move. They also noted that another 25 bp hike on March 22 is fully priced in, while one last 25 bp hike in the second quarter is nearly 45% priced in that would take the Fed Funds rate ceiling up to 5.25%. ''However,'' they said, ''the swaps market continues to price in an easing cycle by year-end and we just don’t see that happening.''
So, when we weigh up the prospects of a rethink along the curve and compare this to the recent price action and historic structures, timeline support/resistance areas, it would be reasonable to assume a corrective bias and start to plan for such as a tradable opportunity, as follows:
Gold price weekly chart
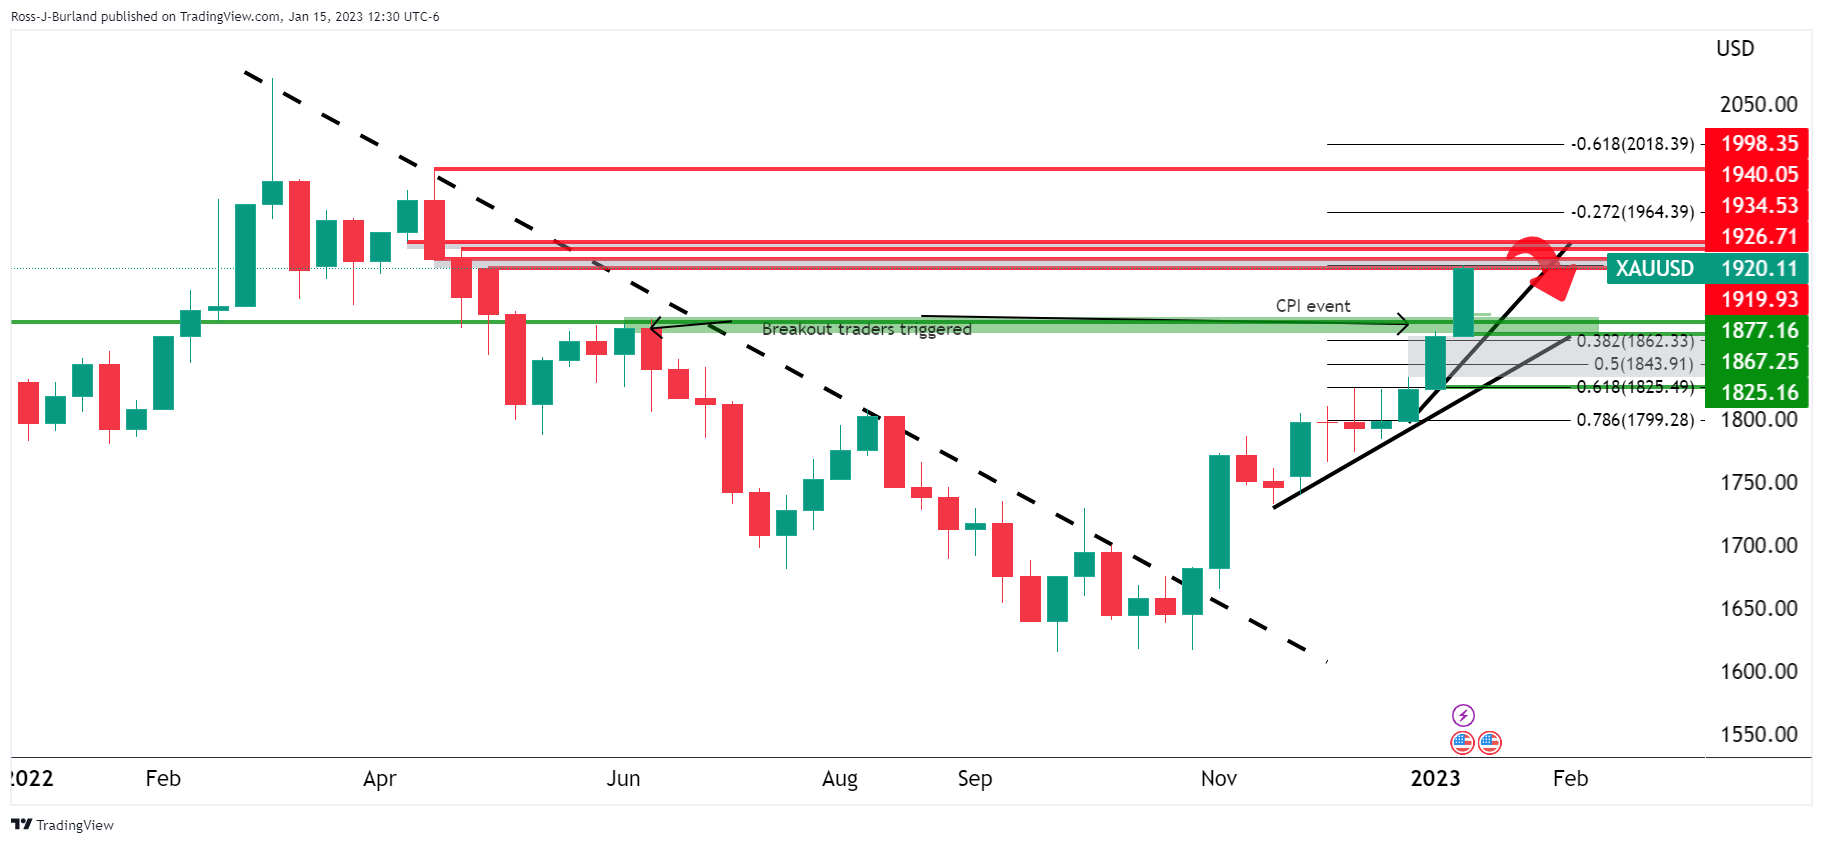
The Gold price rallied beyond the June 2022 and November 2021 highs triggering breakout traders, and those with wide stops remain in the money. The 38.2% Fibonacci retracement level could be an attractive area for a pullback that coincides with the price imbalance below as well as a reasonable area for where stops are placed that have been trailed higher by those targeting the breakout above the $1,870s.
Gold price daily chart
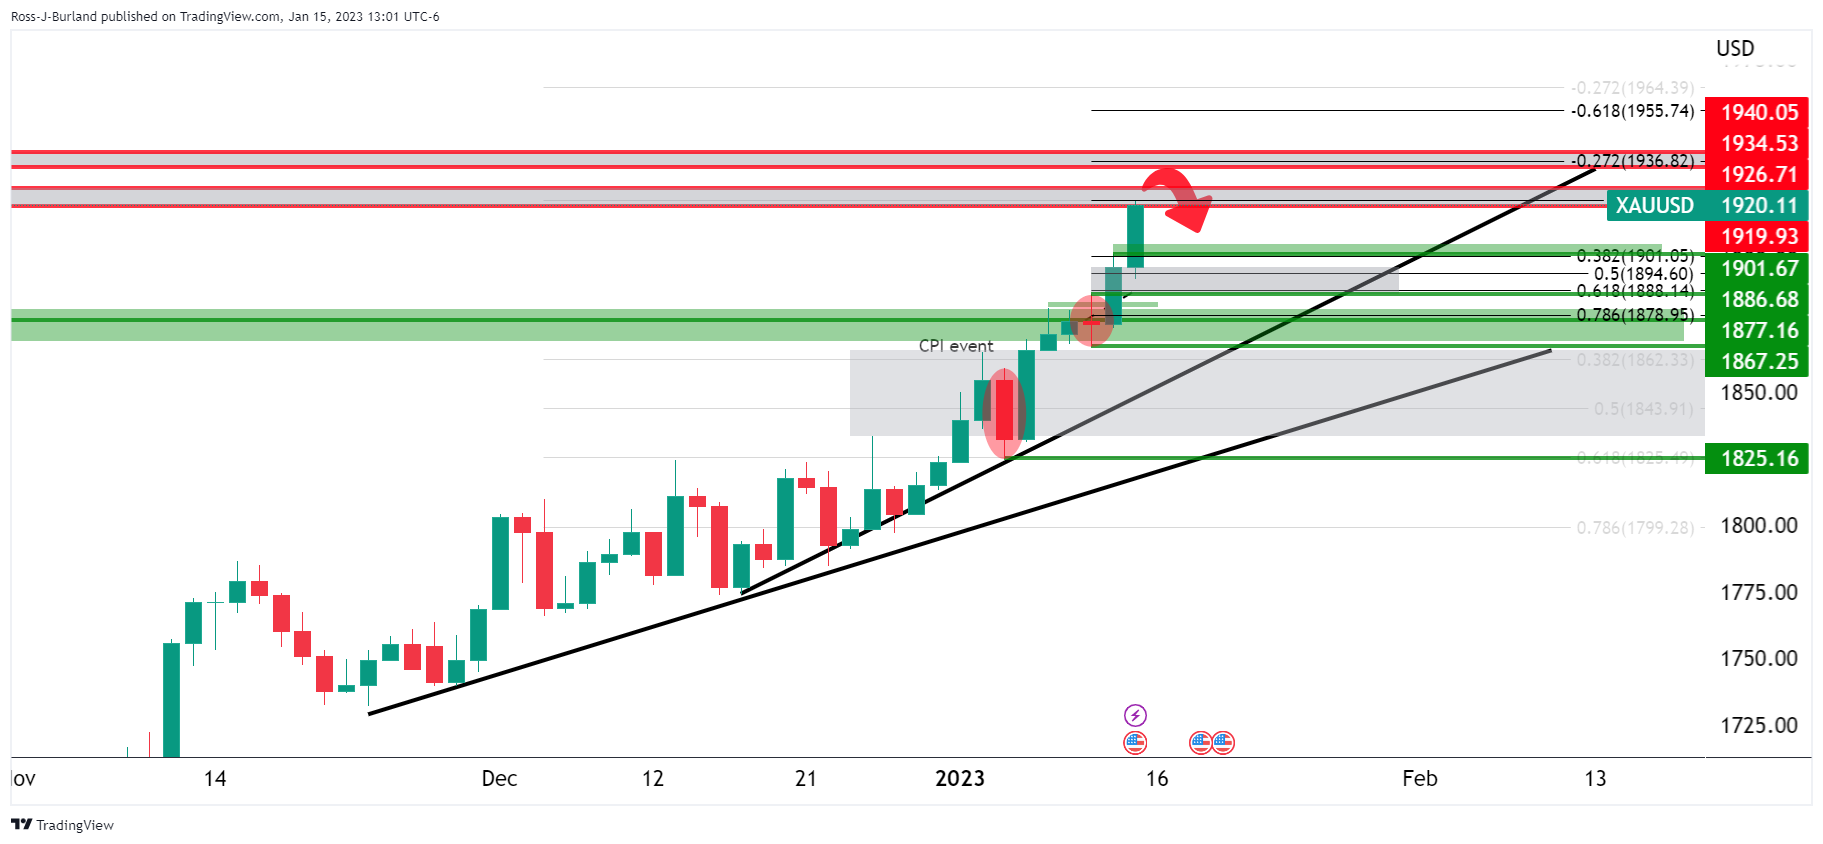
On the daily time frame, we have a price imbalance between the 38.2% Fibonacci and 61.8% Fibonacci. Below that point, $1,888, we have a combination of the bullish trendline and horizontal support as marked by the prior bear candle. A break of those lows, $1,867, bears will be looking for a move into the CPI event range in and around $1,850 with $1,825 eyed as key downside support. The price will then be on the backside of the trend.
Gold H4 chart
On the way there, there will be a downside opportunity but the bears need to get the price on the backside of the 4-hour trendline as follows:
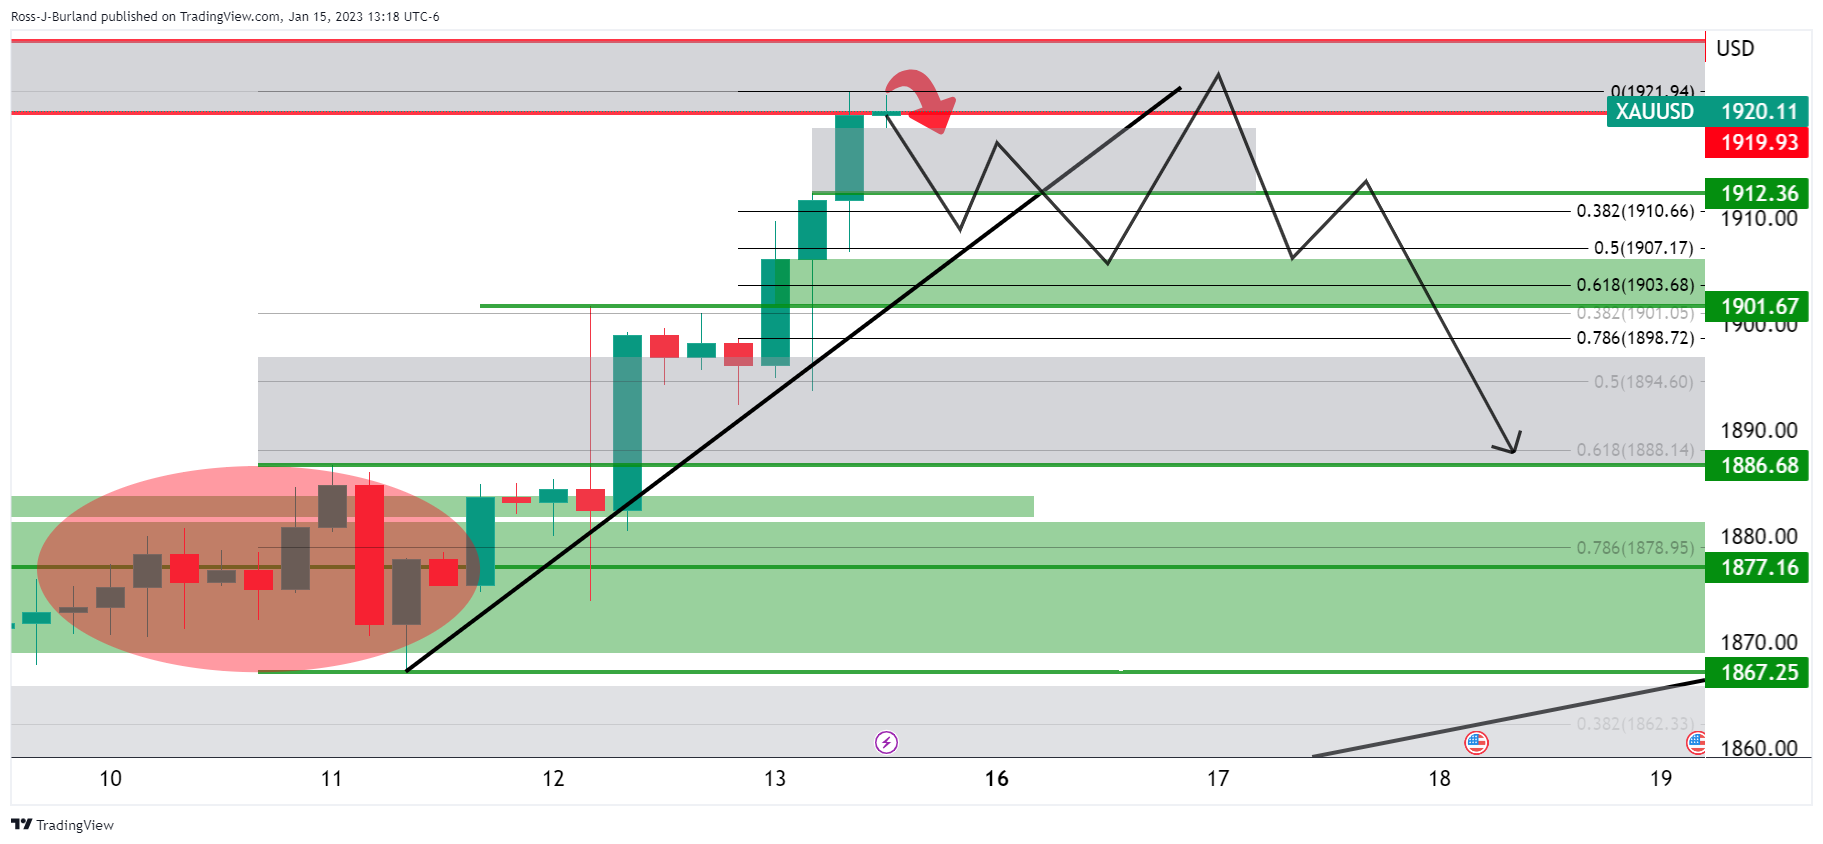
The above schematic is typical of such a breakdown and deceleration of the trend, a) breaking the trendline, b) retesting the peak formation highs and eventually breaking the horizontal support structure as the price melts through the various price imbalances on a fatal basis left behind by bull=ish impulses.
Premium
You have reached your limit of 3 free articles for this month.
Start your subscription and get access to all our original articles.
Author

Ross J Burland
FXStreet
Ross J Burland, born in England, UK, is a sportsman at heart. He played Rugby and Judo for his county, Kent and the South East of England Rugby team.


