Gold Price Forecast: XAU/USD climbs to two-week tops, beyond 200-DMA post-US GDP
- Gold price rallied towards SMA200 one-day on dovish Fed.
- Covid concerns underpin the safe-haven gold despite risk rebound.
- Gold bears await break below 100-day SMA at $1,796

Update: Gold built on the previous day's post-FOMC rebound from the vicinity of the $1,790 horizontal support and gained strong follow-through traction on Thursday. This marked the third successive day of a positive move and was sponsored by the heavily offered tone surrounding the US dollar. A weaker greenback tends to benefit dollar-denominated commodities, including gold.
The USD continues to be weighed down by the Fed Chair Jerome Powell's dovish turn at the post-meeting press conference on Wednesday and was further pressured by Thursday's disappointing US macro releases. The first estimate showed that the world's largest economy expanded by 6.5% annualized pace during the April-June period, missing consensus estimates pointing to an 8.5% growth.
Adding to this, the Initial Weekly Jobless Claims fell more than expected. The dismal data reaffirmed market expectations that the Fed will stick to its ultra-lose monetary policy stance for a longer period. This was seen as another factor that drove some additional flows towards the non-yielding gold, though a combination of factors might keep a lid on any further gains.
A turnaround in the global risk sentiment – as depicted by indications of a strong opening in the US equity markets – might hold investors from placing aggressive bets around the safe-haven XAU/USD. Moreover, the risk-on impulse provided a goodish lift to the US Treasury bond yields, which could also act as a headwind for gold and cap the upside, at least for the time being.
Nevertheless, spot prices, for now, seem to have found acceptance above the very important 200-day SMA and seems poised to climb further. However, it will still be prudent to wait for some follow-through buying beyond monthly swing highs, around the $1,832-34 region, before positioning for any further near-term appreciating move.
Previous update: Gold price has accelerated its advance and hits fresh weekly highs at $1819, closing in on the critical 200-Daily Moving Average (DMA) at $1821. The dovish Fed-induced weakness in the US Treasury yields and the dollar is main underlying reason behind the persistent upbeat mood around gold price. Fed Chair Jerome Powell turned dovish by stating that the employment sector is far from ‘substantial progress’ and therefore, "Fed has not made any decisions about the timing of taper." Meanwhile, the rebound in Chinese stocks has lifted the overall market mood, exacerbating the pain in the safe-haven dollar while benefiting gold price. Gold bulls also draw support from the renewed optimism on a potential US infrastructure stimulus deal. Traders now await the US advance Q2 GDP report for the next direction in gold price. The US economy is expected to expand by 8.6% in Q2 vs. a 6.4% growth recorded in the first quarter.
Read: US Q2 GDP Preview: Economy to continue to expand at strong pace
The Fed once again came to the rescue of the bulls, lifting gold price from around the key support around $1792 to take on the upside beyond the $1800 mark. So far this Thursday, gold price is extending the post-Fed rally towards the critical SMA200 one-day at $1821, as Chair Jerome Powell expressed no hurry to embark upon the tapering journey. Powell also dismissed higher inflation as transitory. The dovish Fed outcome smashed the US dollar alongside the Treasury yields, reviving gold buyers.
Meanwhile, rising covid cases globally also keep gold’s safe-haven appeal alive, as investors now look forward to the US advance Q2 GDP report for fresh hints on the economic recovery, which could have a significant impact on gold trades.
Gold Price: Key levels to watch
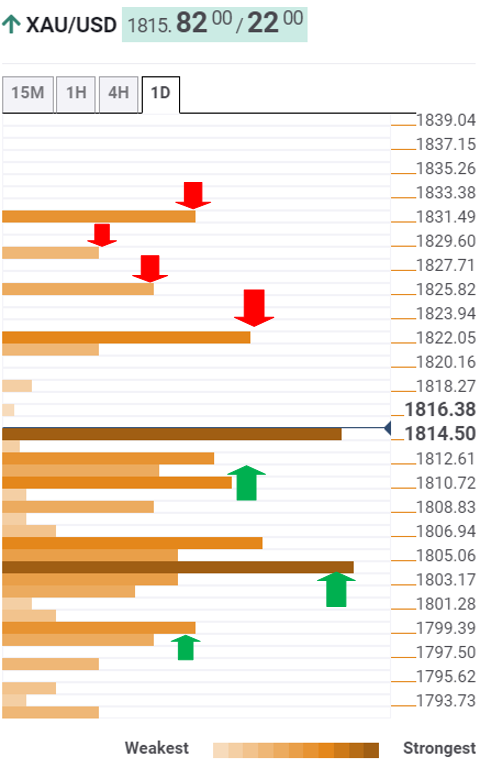
The Technical Confluences Detector shows that gold has recaptured critical resistance at $1815, which is the convergence of the Fibonacci 38.2% one-month, pivot point one-day R1 and Bollinger Band one-hour Upper.
A firm break above the latter has opened gates towards $18211, the intersection of the SMA200 one-day and pivot point one-week R1.
If the buyers seize control above that barrier, then a test of the previous week’s high of $1825 could be in the offing.
The next relevant upside target is envisioned at the Bollinger Band one-day Upper.
The confluence of the SMA50 one-day and the pivot point one-day R3 at $1832 is the last line of defense for gold bears.
Alternatively, a dense cluster of healthy support levels is stacked up near $1811, which will offer an immediate cushion to the downside.
That zone is the meeting point of the Fibonacci 61.8% one-week, previous day’s high and Bollinger Band four-hour Upper.
Bulls will then seek some support at $1807, the SMA10 one-day.
Further south, the bears need to crack this key demand zone around $1804, where the Fibonacci 38.2% one-day and one-week coincide with the SMA50 four-hour and SMA5 one-day.
The confluence of the SMA100 one-day and Fibonacci 61.8% one-day at $1798 is the level to beat for gold sellers.
Here is how it looks on the tool
About Technical Confluences Detector
The TCD (Technical Confluences Detector) is a tool to locate and point out those price levels where there is a congestion of indicators, moving averages, Fibonacci levels, Pivot Points, etc. If you are a short-term trader, you will find entry points for counter-trend strategies and hunt a few points at a time. If you are a medium-to-long-term trader, this tool will allow you to know in advance the price levels where a medium-to-long-term trend may stop and rest, where to unwind positions, or where to increase your position size.
Author

Dhwani Mehta
FXStreet
Residing in Mumbai (India), Dhwani is a Senior Analyst and Manager of the Asian session at FXStreet. She has over 10 years of experience in analyzing and covering the global financial markets, with specialization in Forex and commodities markets.


