Gold Price Forecast: XAU/USD grinds higher past $1,800 as traders brace for ECB, BOE
- Gold bears are monitoring for a deceleration in the bullish correction, now at critical resistance.
- The 4-hour time frame offers a compelling picture of the market structure.

Update: Gold (XAU/USD) prices tease weekly top surrounding $1,810 as markets turn cautious ahead of monetary policy meetings from ECB and BOE.
The bright metal rose to a one-week high during the four-day uptrend the previous day before easing from $1,810, taking round to $1,808 during Thursday’s Asian session.
The bullion’s recent upside momentum could be linked to the US dollar’s weakness as the market shifts attention from the hawkish Fed. Also exerting downside pressure on the greenback is the upbeat performance of the Euro as inflation jumped to a record high before the key monetary policy meeting by the European Central Bank (ECB). Additionally, a surprisingly downbeat US ADP Employment Change for January, -301K versus +207K expected, also weighed on the US Dollar Index (DXY).
On the contrary, hawkish comments from the Fed Nominees from US President Joe Biden join the downbeat performance of the S&P 500 Futures to challenge the gold buyers. It’s worth noting that the Wall Street benchmarks remained firmer and the US Treasury yields eased the previous day.
Moving on, traders will pay major attention to the ECB and the BOE outcomes considering the latest strong fundamentals suggesting hawkish results, which in turn could add to the downside pressure on the US dollar and favor gold buyers.
End of update.
As per the Chart of the Week analysis, the daily M-formation that was noted has played out as follows.
It was stated that ''considering the trendline support and the daily M-formation, the technicians would argue that a significant correction of the bearish impulse could be in play...''
Gold, daily chart prior analysis
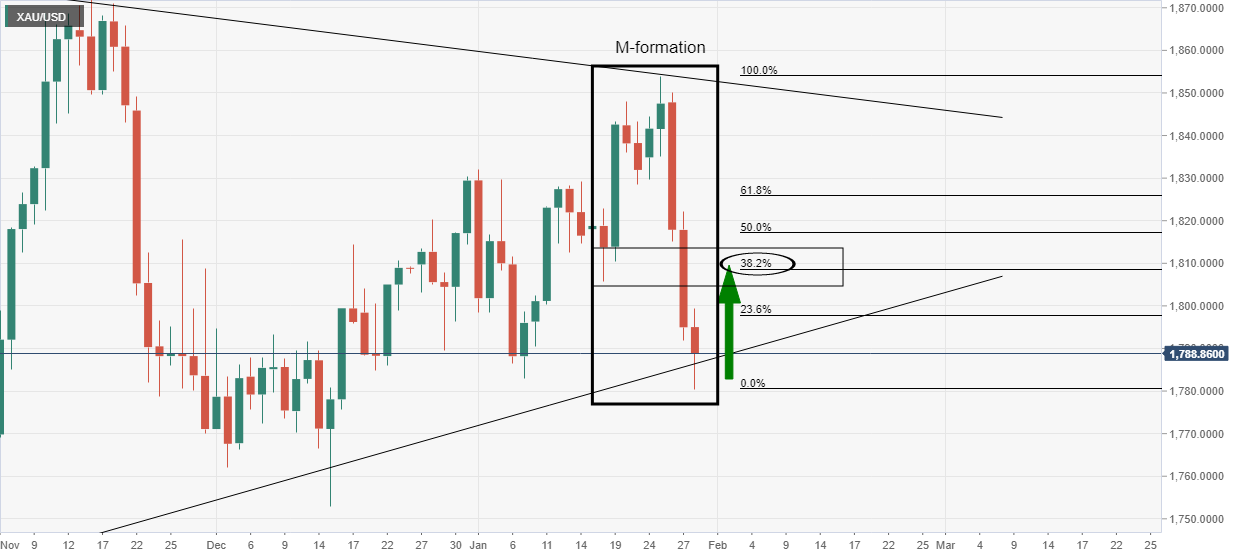
In the case above, the 38.2% Fibonacci retracement level near $1,810 was the initial target area that had a confluence with prior structure as illustrated.
Gold, live market
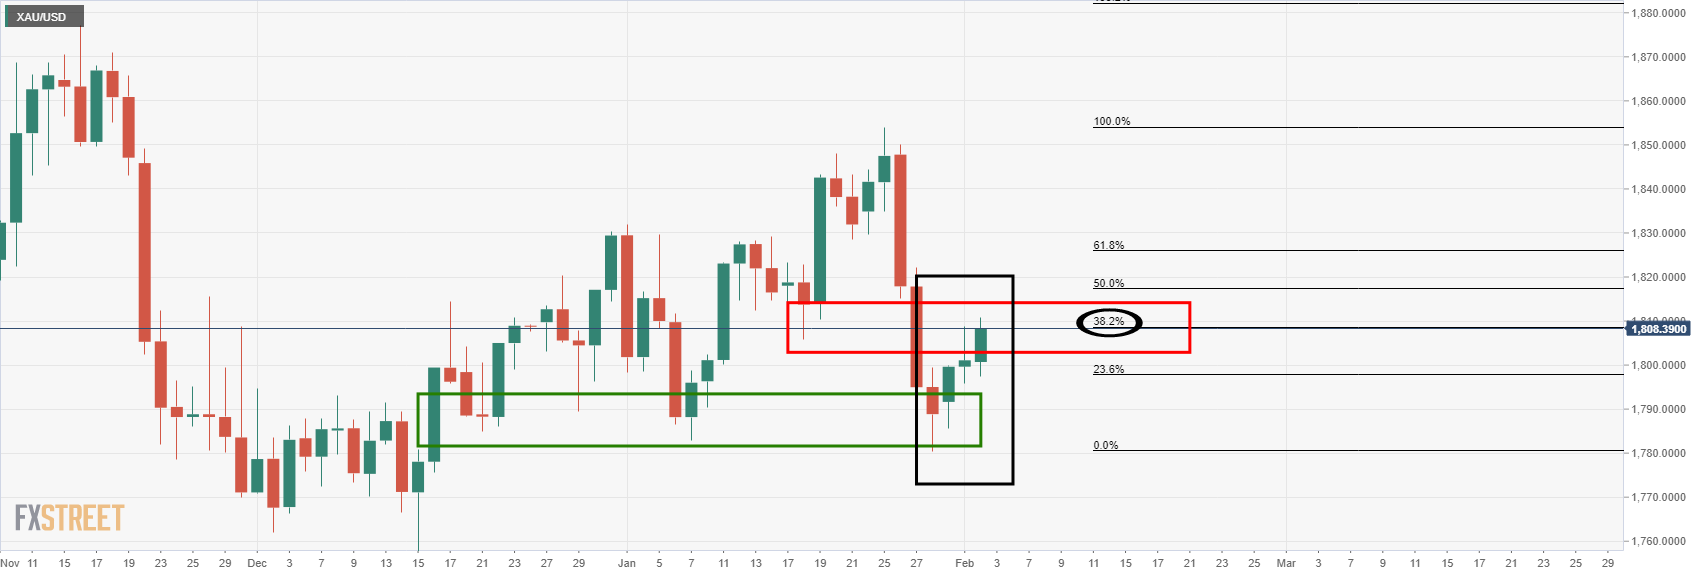
So far so good.
What bears will now want to see is a deceleration in the price action. This can be monitored from a lower time frame, such as the 4-hour chart:

In the above chart, we can see a number of interesting structures that leave a bearish bias below the $1,820's. The price would be expected to move lower to test the W-formation's neckline near $1,802 as follows:

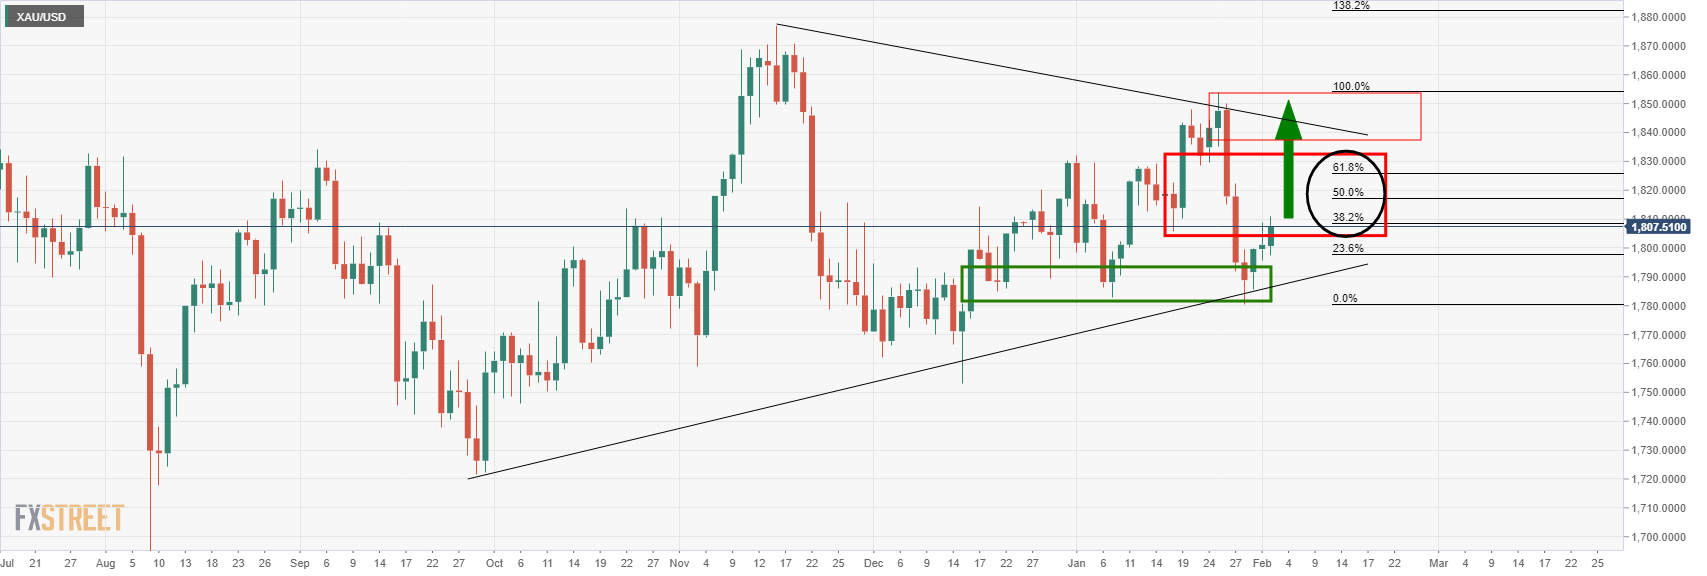
As stated at the start of the week's analysis in the Chart of the Week, ''should this playout, and if the bears commit ... additional supply could be the straw that breaks the camel's back for a sizeable continuation to crack the trendline support as follows:

On the other hand, if the US dollar gives way again, then the neckline of the M would be the last defence for a restest of the wedge resistance the $1,850's once again:
Author

Ross J Burland
FXStreet
Ross J Burland, born in England, UK, is a sportsman at heart. He played Rugby and Judo for his county, Kent and the South East of England Rugby team.


