Gold Price Forecast: XAU/USD hangs near weekly lows, below $1,800 mark
- Gold remains on the back foot around intraday low, down for the second consecutive day.
- Firmer US Treasury yields, inflation expectations underpin Fed tapering concerns, favoring bears.
- US dollar consolidates weekly gains ahead of the US Durable Goods Orders.
- Gold Price Forecast: Losing its shine and the 1,800 threshold

Update: Gold edged lower for the second successive day and dropped back closer to the overnight swing lows heading into the European session. Currently hovering around the $1,785 region, the prevalent risk-on environment in the markets turned out to be a key factor that undermined the safe-haven precious metal. Apart from this, expectations for an early policy tightening by major central banks, including the Fed, further acted as a headwind for the non-yielding yellow metal. Bulls seemed unimpressed by a subdued US dollar price action, which tends to lend some support to the dollar-denominated commodity.
Moving ahead, traders on Wednesday will take cues from the release of US Durable Goods Orders data, due later during the early North American session. Investors will also focus on the Advance US Q3 GDP growth report on Thursday, which will set the tone heading into the FOMC meeting next week and provide some meaningful impetus to gold prices. In the meantime, elevated US Treasury bond yields should extend some support to the greenback and keep a lid on any meaningful upside for the metal.
Previous update: Gold (XAU/USD) extends the previous day’s losses below $1,800 heading into Wednesday’s European session.
The yellow metal snapped a five-day uptrend on Tuesday while confirming the bearish chart pattern, rising wedge. The corrective pullback, however, failed to reject formation and keeps the sellers hopeful amid firming expectations of the Fed tapering.
US inflation expectations jump to the highest levels last seen during May 2006, marking acute pressure on the Fed policymakers to consolidate the easy money streams. The same propels the US 2-year Treasury yields to the highest since May 2020, around 0.49% by the press time. The much-followed US 10-year Treasury yields also snap a three-day downtrend and challenge the stock future, up by one basis point around 1.62% at the latest.
It should be noted that the US stimulus and upbeat start to the Q3 earnings season seem to keep the equity buyers hopeful, challenging the gold bears. However, cautious mood ahead of the key advance estimation of the US Q3 GDP weighs on the precious metal.
Furthermore, the news of the US ban on China telecom over national security concerns and the Chinese summoning of the property companies to gauge the financial risk exert additional downside pressure on the gold prices.
Looking forward, the US Durable Goods Orders for September, expected -1.1% versus +1.8% prior, may entertain short-term gold traders but the key will be the US GDP and chatters surrounding inflation.
Read: US Third Quarter GDP Preview: A most uncertain estimate
Technical analysis
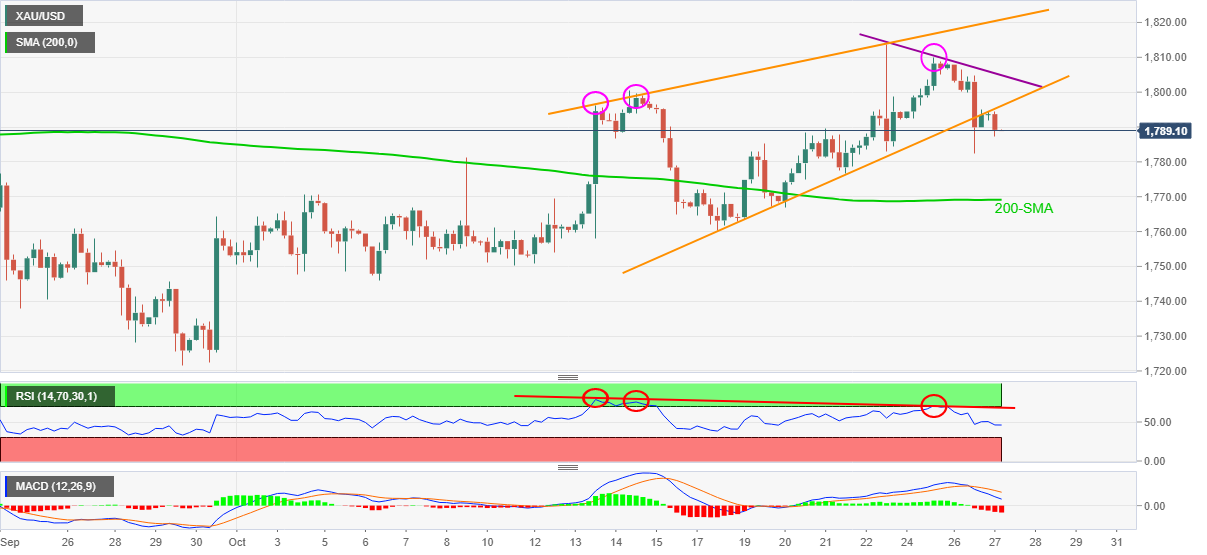
Gold buyers seemed to have finally stepped back as the quote confirmed a bearish chart pattern, namely rising wedge, on the four-hour (4H) play. Also keeping the sellers hopeful is the hidden bearish divergence between the RSI and prices, not to forget the MACD conditions teasing sellers.
Hence, a clear downside break of $1,795 should set the ball rolling for the gold bears to aim for the theoretical target of $1,740.
During the fall, the 200-SMA level surrounding $1,770 may offer an intermediate halt whereas the monthly low around $1,746 and September’s bottom near $1,721 will challenge the gold bears afterward.
Alternatively, an upside clearance of the weekly resistance line, close to $1,807 by the press time, guards the precious metal’s immediate upside before the monthly peak of $1,814.
It should be noted, however, the upper line of the stated wedge and tops marked since July, respectively around $1,820 and $1,834, will become the tough nuts to crack for the gold buyers then after.
Gold: Four-hour chart
Trend: Further weakness expected
Author

Anil Panchal
FXStreet
Anil Panchal has nearly 15 years of experience in tracking financial markets. With a keen interest in macroeconomics, Anil aptly tracks global news/updates and stays well-informed about the global financial moves and their implications.
















