Gold Price Forecast: Losing its shine and the 1,800 threshold

XAU/USD Current price: $1,793.00
- Wall Street posted record highs before retreating, underpinned by solid earnings reports.
- US Treasury yields eased toward the lower end of their weekly range.
- XAU/USD has lost its bullish potential, but a steeper decline is not yet confirmed.
Gold edged lower on Wednesday, trading as low as $1,782.31 a troy ounce. The greenback strengthened ever since the day started against its commodity-rival, getting a boost early in the American session from upbeat US data and rallying equities.
Wall Street opened with gains, reaching record levels ahead of the opening, underpinned by solid earnings reports, with the DJIA and the S&P 500 reaching all-time highs and the Nasdaq Composite flirting with its record value. However, equities lost momentum afterwards, and major indexes are currently trading mixed around their opening levels.
The US Richmond Fed Manufacturing Index improved to 12 in October, much better than the previous -3 or the expected 3. New Home Sales increased by 14% MoM in September, while CB Consumer Confidence unexpectedly bounced in October, printing at 113.8 from an upwardly revised 109.8. According to the official report, “the proportion of consumers planning to purchase homes, automobiles, and major appliances all increased in October—a sign that consumer spending will continue to support economic growth through the final months of 2021.”
Meanwhile, US government bond yields retreated to the lower end of their weekly range, with the benchmark on the 10-year Treasury note currently at around 1.62%. Gold managed to recover from the mentioned daily low but remains below the critical 1,800 threshold.
Gold price short-term technical outlook
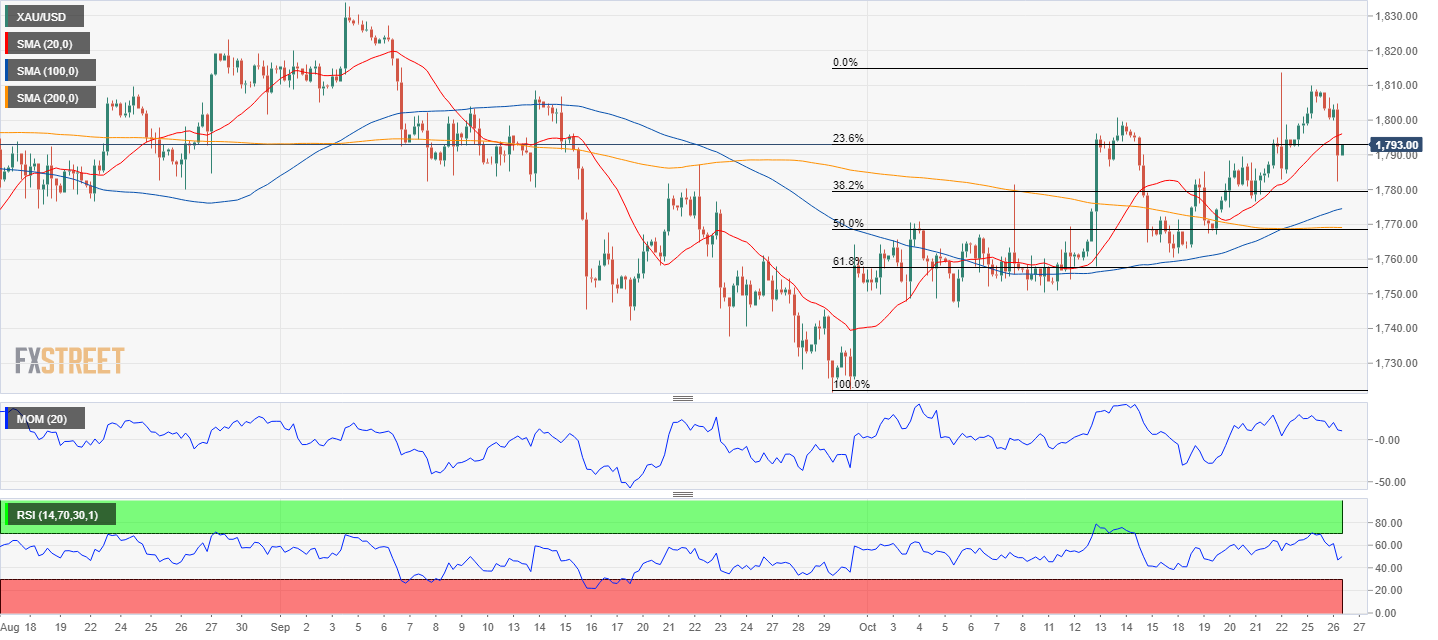
XAU/USD is trading at around $1,793 a troy ounce, a handful of cents above the 23.6% retracement of its latest bullish run. The daily chart shows that the price is also converging with a bearish 100 SMA and a directionless 200 SMA, which reinforce the actual support area. Technical indicators, in the meantime, turned lower but hold within positive levels, as the 20 SMA maintains its bullish slope well below the current level, all of which limits the bearish potential.
In the near term, and according to the 4-hour chart, the risk is skewed to the downside, although the pair needs to confirm a new leg south. The bright metal has broken below a now directionless 20 SMA, while technical indicators retreated from near overbought readings to their midlines, where they are now consolidating. The next Fibonacci support level comes at 1,778.60, the level to break to confirm a steeper decline.
Support levels: 1,790.60 1,778.60 1,767.50
Resistance levels: 1,813.80 1,823.15 1,833.95
Author

Valeria Bednarik
FXStreet
Valeria Bednarik was born and lives in Buenos Aires, Argentina. Her passion for math and numbers pushed her into studying economics in her younger years.
















