Gold Price Analysis: XAU/USD’s weekly close above $1928 exposes next two key levels – Confluence Detector

Gold (XAU/USD) settled the past week at two-week highs of $1930.60, having recorded the second straight weekly gain. The yellow metal tracked the rally in stocks amid a broad US dollar sell-off, induced by the increased expectations of the US policymakers agreeing on a comprehensive fiscal stimulus deal.
Heading into a fresh week, gold traders will continue to closely follow the developments concerning the multi-trillion-dollar aid package alongside the US inflation, consumer spending data and Fedspeak for fresh direction on the prices.
From a technical perspective, let’s see how gold is positioned, especially in the wake of the bullish breakout.
Gold: Key resistances and supports
Gold gave a weekly closing above the critical $1928 level on Friday, opening doors for the further upside.
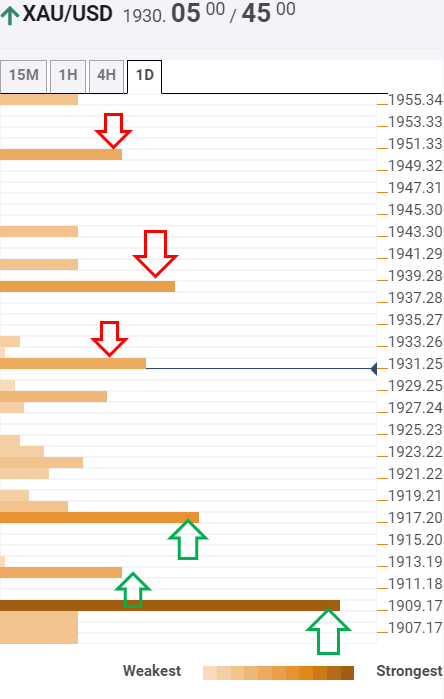
The Technical Confluences Indicator suggests that the XAU bulls need a break above the immediate hurdle at $1931, the previous day high, for the next leg higher.
Strong cap at $1938 will be next on the buyers’ radar. That level is the Fibonacci 61.8% one-month.
Further, the pivot point one-week R1 lies at $1950, which could be the level to beat for the bulls.
On the flip side, powerful support awaits at $1918, the confluence of the Fibonacci 38.2% one-day and Fibonacci 23.6% one-week.
The next soft cap is seen at $1912 (SMA100 15-minutes), below which the robust support at $1910 could be put at risk. At the latter, the Fibonacci 38.2% one-week and SMA10 four-hour coincide.
Here is how it looks on the tool
About Confluence Detector
The Confluence Detector finds exciting opportunities using Technical Confluences. The TC is a tool to locate and point out those price levels where there is a congestion of indicators, moving averages, Fibonacci levels, Pivot Points, etc. Knowing where these congestion points are located is very useful for the trader, and can be used as a basis for different strategies.
Learn more about Technical Confluence
Author

Dhwani Mehta
FXStreet
Residing in Mumbai (India), Dhwani is a Senior Analyst and Manager of the Asian session at FXStreet. She has over 10 years of experience in analyzing and covering the global financial markets, with specialization in Forex and commodities markets.


