|

Gold Price Analysis: XAU/USD holds onto 100-DMA support ahead of the NFP week

  • Gold looks south, with the focus on the key 100-DMA support.
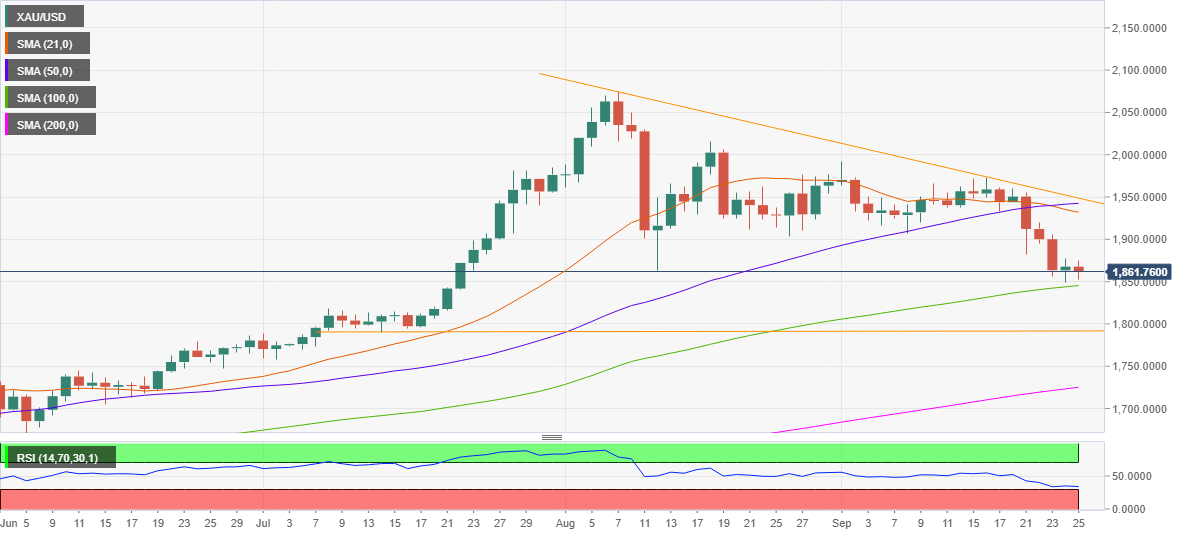
  • $1932/42 zone is the level to beat for the bulls.
  • Focus on US NFP release for the next direction in gold.

Following the 4.5% weekly loss, Gold (XAU/USD) has locked itself in a $100 range stepping into the critical US Non-Farm Payrolls week, as depicted by the daily chart.

The metal fell to the lowest in two months last week after it faced rejection at the two-month-long falling trendline resistance on several occasions. Adding credence to the breakdown, the 21-day Simple Moving Average (DMA) pierced the 50-DMA from above.

The bright metal delivered a weekly closing at $1862, although remained well above the 100-day Simple Moving Average (DMA) at $1845. Note that the price bounced-off the latter for the second straight day on Friday, allowing for a tepid rebound in the coming week.

However, the bulls need to recapture the immediate hurdle around $1875 for the recovery to gain momentum.

Further north, the confluence zone of the 21 and 50-DMA around $1932/42 is the level to beat for the bulls

On the flip side, a daily closing below the 100-DMA could trigger a sharp sell-off towards the next support at the horizontal trendline at $1791.

The 14-day Relative Strength Index (RSI) has turned flat while holding just above the oversold territory, suggesting that there is further scope to the downside.

Although, Friday’s US NFP report will be a key event risk to determine the next direction in gold prices.

Gold: Daily chart

fxsoriginal

Gold Additional levels

XAU/USD

Overview
Today last price1861.76
Today Daily Change0.00
Today Daily Change %0.00
Today daily open1861.76
 
Trends
Daily SMA201930.4
Daily SMA501942.58
Daily SMA1001845.41
Daily SMA2001724.82
 
Levels
Previous Daily High1875.23
Previous Daily Low1852.46
Previous Weekly High1955.66
Previous Weekly Low1848.84
Previous Monthly High2075.32
Previous Monthly Low1863.24
Daily Fibonacci 38.2%1861.16
Daily Fibonacci 61.8%1866.53
Daily Pivot Point S11851.07
Daily Pivot Point S21840.38
Daily Pivot Point S31828.3
Daily Pivot Point R11873.84
Daily Pivot Point R21885.92
Daily Pivot Point R31896.61

Author

Dhwani Mehta

Dhwani Mehta

FXStreet

Residing in Mumbai (India), Dhwani is a Senior Analyst and Manager of the Asian session at FXStreet. She has over 10 years of experience in analyzing and covering the global financial markets, with specialization in Forex and commodities markets.

More from Dhwani Mehta
Share:

Editor's Picks

GBP/USD appears well offered near 1.3160

GBP/USD builds on Tuesday’s losses, although it now manages to pick up some pace and bounce off earlier multi-month troughs near 1.3140. The Greenback’s solid performance and continued political turmoil in the UK are keeping Cable under persistent pressure, with little sign of a meaningful recovery.

EUR/USD rebounds from lows, back to 1.1360

After bottoming out near 1.1320, EUR/USD gathers some traction and reclaims the 1.1350-1.1360 band as the NA session draws to a close on Wednesday. The pair’s drop to multi-month lows comes in response to the continuous leg higher in the US Dollar, which remains propped up by hawkish Fed expectations and uncertainty over the outcome of US-Iran peace negotiations.

Gold pressured near fresh 2026 lows

Gold accelerates its decline and gyrates around the key $4,000 mark per troy ounce on Wednesday, its lowest level since November 2025. In the meantime, tighter-for-longer Fed expectations and a broadly firmer US Dollar continue to weigh on the yellow metal, while uncertainty surrounding a potential US-Iran peace agreement has done little to revive demand for the safe haven space.

XRP nears key support as Fed hike risks suppress demand
Ripple (XRP) continues to face significant selling pressure, trading around $1.05 at the time of writing on Wednesday. This decline mirrors the broader weakness in the crypto market, exacerbated by mounting macroeconomic headwinds and persistent geopolitical uncertainties.
US-Iran talks: The next 60 days will decide where Oil prices go next
Oil markets received some encouraging news after weeks of rising tensions in the Middle East. But let’s not get ahead of ourselves: we’re far from victory, and markets just seem to have priced out the worst-case scenario. The US and Iran have reportedly made "substantive progress" in talks in Switzerland and agreed on a framework for working toward a broader deal within 60 days.
Regime change: Inside Kevin Warsh's first move to make the Fed unreadable on purpose

The rate did not move. That was the least interesting thing about Kevin Warsh's first meeting in charge of the Fed. The FOMC held its benchmark at 3.50%-3.75% for the fourth straight meeting, exactly as priced, and then the new chair used his first press conference to dismantle the machinery the market has leaned on for a decade.