|

Gold Price Analysis: XAU/USD eyes $1900 amid T-yields rally, ahead of NFP – Confluence Detector

Gold (XAU/USD) continues to feel the pull of gravity and closes in on the critical $1900 support. The narrative of reflation trades plays out, driving Treasury yields higher on expectations of higher fiscal stimulus by the Biden administration.

The Fed’s view on rising inflation expectations also backs the upside in the US rates, weighing on the yieldless gold. Higher yields could continue to support the US dollar’s rebound, as markets digest encouraging Pfizer’s coronavirus vaccine news.

All eyes now turn towards the US payrolls release for fresh direction on the yellow metal. How is gold positioned on the charts heading into the critical US jobs data.

Gold Price Chart: Key resistances and supports

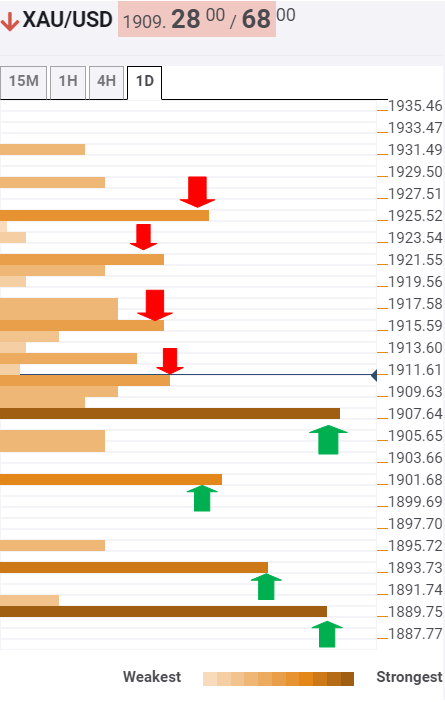
The Technical Confluences Indicator shows that gold is threatening strong support at $1908, which is a confluence of the previous month high and the previous day low.

A breach of the last could expose the critical $1900 support zone, the intersection of the previous week high and Bollinger Band four-hour lower.

Further south, the sellers could challenge the meeting point of the Fibonacci 23.6% one-week and SMA100 one-day at $1894.

The last reprieve for the XAU bulls is seen at $1890, the Fibonacci 38.2% one-week, below which the upbeat momentum could be negated.

On the flip side, $1911 poses an immediate resistance for gold, which is the pivot point one-week R1.

The next relevant hurdle awaits around $1916/17 region, the confluence zone of the Fibonacci 38.2% one-day, SMA5 four-hour and the previous high on four-hour.

The buyers will then target the pivot point one-week R2 at $1920. Acceptance above the latter could bring the $1925 back in play.

That level is the convergence of the SMA5 one-day and pivot point one-day R1.

Here is how it looks on the tool
fxsoriginal

About Confluence Detector

The TCI (Technical Confluences Indicator) is a tool to locate and point out those price levels where there is a congestion of indicators, moving averages, Fibonacci levels, Pivot Points, etc. Knowing where these congestion points are located is very useful for the trader, and can be used as a basis for different strategies.

Learn more about Technical   Confluence

Author

Dhwani Mehta

Dhwani Mehta

FXStreet

Residing in Mumbai (India), Dhwani is a Senior Analyst and Manager of the Asian session at FXStreet. She has over 10 years of experience in analyzing and covering the global financial markets, with specialization in Forex and commodities markets.


More from Dhwani Mehta
Share:

Editor's Picks

AUD/USD holds above 0.6950 as bullish USD caps gains

AUD/USD edges lower during the Asian session on Tuesday, stalling a two-day recovery move from a two-month low, touched last week. An extended rout in the fixed income market keeps US bond yields elevated near multi-year highs. This, along with geopolitical uncertainties, helps the US Dollar retain its bullish tone despite receding October Fed hike bets. However, expectations for another RBA rate hike this month could act as a tailwind for the Aussie.

USD/JPY remains confined in a range; 158.00 holds the key

USD/JPY extends its consolidative move during the Asian session on Tuesday, trading below 158.00 amid diverging forces. Hawkish BoJ expectations support the Japanese Yen amid looming intervention risks. Meanwhile, geopolitical uncertainty and elevated US bond yields keep the US Dollar near its YTD high despite receding October Fed hike bets. This, in turn, holds back traders from placing aggressive directional bets.

Gold holds steady below $4,150 as receding Fed hike bets lend support

Gold continues its struggle to gain any meaningful traction, holding steady below $4,150 during the Asian session on Tuesday. Receding October Fed hike bets act as a tailwind for the non-yielding bullion, though a bullish US Dollar caps the upside. Furthermore, traders await the release of the FOMC Minutes on Wednesday for more cues about the future policy path and some meaningful impetus.

Ethereum: BitMine scoops extra ETH tokens following Q3 outperformance
Ethereum (ETH) treasury firm BitMine Immersion continued its buying streak of the top altcoin last week. The firm acquired 15,112 ETH, lifting its holdings to 6.016 million ETH, representing 4.9% of ETH's circulating supply and worth $16.16 billion at the time of writing. That brings the company roughly 98.5% closer to acquiring 5% of ETH's supply, a goal it tags "Alchemy of 5%."
Markets just priced out rate hikes on financial stress. This chart shows why 2022-23 says they’ll be wrong

Traders have taken about one quarter-point hike out of their European Central Bank forecasts since mid-September, betting the ECB will stop raising rates because of a French debt selloff. The same bet failed twice in 2022 and 2023, when the ECB kept raising rates through financial stress because inflation was above its 2% target. Euro-area inflation came in at 3.8% in September.

Eurozone inflation just hit 3.8%, its highest in three years. This chart shows why the ECB can’t simply hike its way out

The ECB would normally have a relatively straightforward answer to inflation running almost twice its target: raise interest rates. But these are not normal circumstances. This time, the bond market is already doing part of the tightening for it, leaving the ECB facing an increasingly difficult dilemma.