Dow Jones Industrial Average declines amid Trump tariff threats tied to Greenland
- US stocks slid as Trump tariff threats tied to Greenland fueled risk-off trading, higher yields, and a weaker dollar.
- Major indices fell into the red for the year, led by tech losses as policy risk exposed stretched valuations.
- Small caps outperformed on Fed rate cut hopes and domestic exposure, while defensive stocks held up better.

US equities sold off sharply on Tuesday as geopolitical risk surged after President Donald Trump escalated rhetoric around acquiring Greenland, including new tariff threats against close US allies. Markets reacted swiftly to the prospect of a renewed trade conflict, with investors reducing exposure to US assets amid concerns that tariffs are being used as a political tool rather than a purely economic one. Treasury yields jumped, the US Dollar (USD) weakened around 1%, and volatility spiked as risk sentiment deteriorated.
Frontline indexes decline, market withers on Greenland turmoil
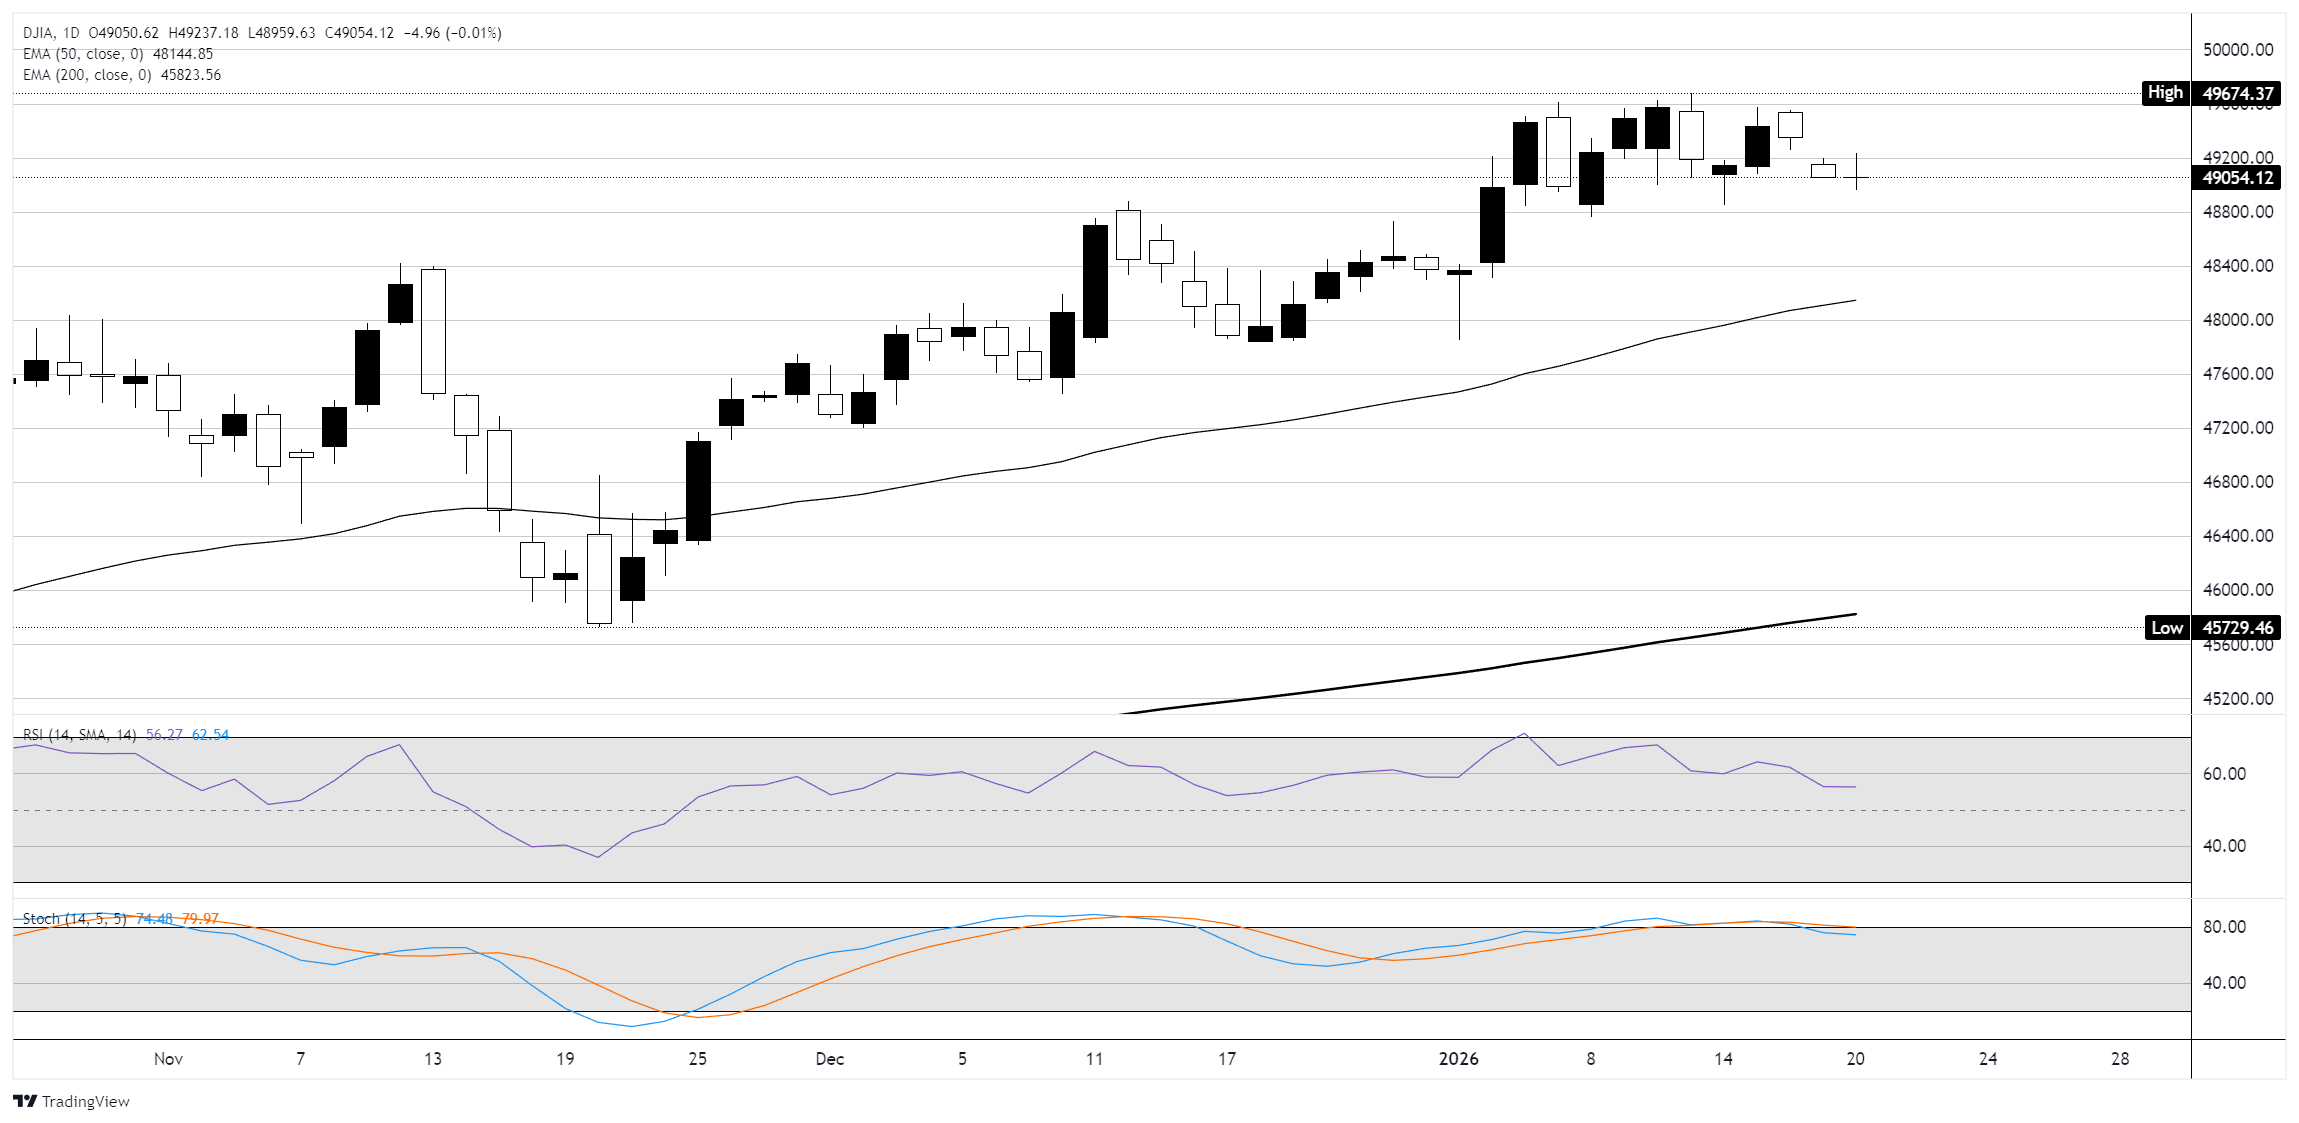
The Dow Jones Industrial Average (DJIA) fell 1.4%, while the S&P 500 and Nasdaq Composite declined 1.6% and 1.8%, respectively, pushing both indices into negative territory for the year. The VIX climbed above 20 for the first time since late November, reflecting rising uncertainty. Trump outlined plans to impose tariffs starting at 10% on imports from eight NATO countries on February 1, rising to 25% by June, and separately threatened 200% tariffs on French wine and champagne. European leaders have signaled strong opposition and are reportedly considering retaliatory measures, raising the risk of a broader escalation.
Market participants warned that equities were already priced for optimistic outcomes, leaving them vulnerable to policy shocks. Investors also grew uneasy about longer-term implications for capital flows, with concerns that persistent trade conflict could reduce foreign appetite for US assets and debt. The backdrop reinforced a global risk-off move, with the Euro strengthening against the Dollar and bonds selling off sharply. Trump is expected to address the issue with European leaders during meetings in Davos, where the topic has already drawn significant attention.
Key value segments draw fresh investing crowds
Technology stocks remained under pressure, leaving the Nasdaq trading lower on the year as several large-cap leaders continued to slide. Apple (AAPL) and Meta (META) are down roughly 8% year to date, while Microsoft (MSFT) has fallen about 6%, highlighting ongoing weakness in high valuation growth names amid rising geopolitical and policy uncertainty. Amid the broader selloff, defensive and value-oriented stocks offered pockets of stability, with Walmart (WMT) and Procter & Gamble (PG) reaching new highs, and insurance names such as Allstate (ALL) posting gains, as investors sought relative safety.
In contrast, small caps again showed relative resilience. The Russell 2000 outperformed the S&P 500 for the twelfth consecutive session, its longest such streak since 2008, and remains up more than 7% in 2026. Expectations for Federal Reserve (Fed) rate cuts, solid domestic growth data, and the index’s heavier exposure to US-focused businesses have helped insulate small caps from trade-related risks.
New Trump pick for Fed Chair expected
On the policy front, Treasury Secretary Scott Bessent said President Trump is close to nominating the next Federal Reserve chair, with a decision potentially coming as soon as next week. The process has narrowed to four candidates, adding another important macro catalyst for markets to monitor.
Dow Jones daily chart
S&P 500 FAQs
The S&P 500 is a widely followed stock price index which measures the performance of 500 publicly owned companies, and is seen as a broad measure of the US stock market. Each company’s influence on the computation of the index is weighted based on market capitalization. This is calculated by multiplying the number of publicly traded shares of the company by the share price. The S&P 500 index has achieved impressive returns – $1.00 invested in 1970 would have yielded a return of almost $192.00 in 2022. The average annual return since its inception in 1957 has been 11.9%.
Companies are selected by committee, unlike some other indexes where they are included based on set rules. Still, they must meet certain eligibility criteria, the most important of which is market capitalization, which must be greater than or equal to $12.7 billion. Other criteria include liquidity, domicile, public float, sector, financial viability, length of time publicly traded, and representation of the industries in the economy of the United States. The nine largest companies in the index account for 27.8% of the market capitalization of the index.
There are a number of ways to trade the S&P 500. Most retail brokers and spread betting platforms allow traders to use Contracts for Difference (CFD) to place bets on the direction of the price. In addition, that can buy into Index, Mutual and Exchange Traded Funds (ETF) that track the price of the S&P 500. The most liquid of the ETFs is State Street Corporation’s SPY. The Chicago Mercantile Exchange (CME) offers futures contracts in the index and the Chicago Board of Options (CMOE) offers options as well as ETFs, inverse ETFs and leveraged ETFs.
Many different factors drive the S&P 500 but mainly it is the aggregate performance of the component companies revealed in their quarterly and annual company earnings reports. US and global macroeconomic data also contributes as it impacts on investor sentiment, which if positive drives gains. The level of interest rates, set by the Federal Reserve (Fed), also influences the S&P 500 as it affects the cost of credit, on which many corporations are heavily reliant. Therefore, inflation can be a major driver as well as other metrics which impact the Fed decisions.
Author

Joshua Gibson
FXStreet
Joshua joins the FXStreet team as an Economics and Finance double major from Vancouver Island University with twelve years' experience as an independent trader focusing on technical analysis.