Gold Price Analysis: XAU/USD bulls to have a bumpy road towards $1,964 – Confluence Detector


Gold prices refresh intraday low near $1,938 while extending pullbacks from the six-week top, flashed the previous day, during early Friday.

The yellow metal recently eased after US election updates suggest President Donald Trump’s lead in Pennsylvanian voting count. Earlier in Asia, news from Georgia and Arizona marked Joe Biden as the front-runner for the US presidency while keeping his 260+ electoral votes, versus 270 required.

Although fears of a hung decision over the blue wave in America probe the US dollar bears, optimism surrounding further easy money, be it from the central banks or governments, enthuses the global risk sentiment.

As a result, equities and commodities cheered the US dollar’s downside during Thursday before portraying a consolidation so far today. That said, S&P 500 Futures print 0.60% intraday losses while stocks in Asia-Pacific trade mixed by press time.
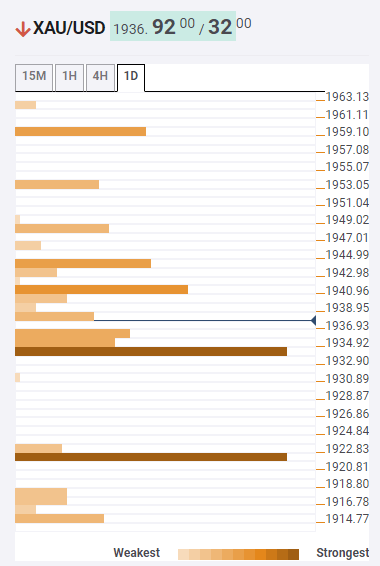
Key levels to watch

Despite the recent pullback, gold prices stay past-$1,934 key support, comprising 38.2% Fibonacci retracement one-day, which in turn favors the bulls to jostle with the immediate resistances.

Among them, 5-SMA on 15-minute, upper band the Bollinger Band (BB) on one-day and 23.6% Fibonacci retracement on daily comprise $1,941 as immediate key upside barrier.

Following that, the middle band of the BB on 15-minutes and 161.8% Fibonacci retracement on one-week, surrounding $1,945, can precede R3 on the weekly pivot point near $1,965 to entertain the gold buyers.

Alternatively, a downside break below $1,934 support will quickly drag the quote towards $1,921 support including SMA10 on the four-hour (4H) as well as R1 on the monthly pivot and 61.8% Fibonacci retracement on one-day.

Here is how it looks on the tool

fxsoriginal

About Confluence Detector

The Confluence Detector finds exciting opportunities using Technical Confluences. The TC is a tool to locate and point out those price levels where there is a congestion of indicators, moving averages, Fibonacci levels, Pivot Points, etc. Knowing where these congestion points are located is very useful for the trader, and can be used as a basis for different strategies.

Learn more about Technical Confluence

Share: Feed news

Information on these pages contains forward-looking statements that involve risks and uncertainties. Markets and instruments profiled on this page are for informational purposes only and should not in any way come across as a recommendation to buy or sell in these assets. You should do your own thorough research before making any investment decisions. FXStreet does not in any way guarantee that this information is free from mistakes, errors, or material misstatements. It also does not guarantee that this information is of a timely nature. Investing in Open Markets involves a great deal of risk, including the loss of all or a portion of your investment, as well as emotional distress. All risks, losses and costs associated with investing, including total loss of principal, are your responsibility. The views and opinions expressed in this article are those of the authors and do not necessarily reflect the official policy or position of FXStreet nor its advertisers. The author will not be held responsible for information that is found at the end of links posted on this page.

If not otherwise explicitly mentioned in the body of the article, at the time of writing, the author has no position in any stock mentioned in this article and no business relationship with any company mentioned. The author has not received compensation for writing this article, other than from FXStreet.

FXStreet and the author do not provide personalized recommendations. The author makes no representations as to the accuracy, completeness, or suitability of this information. FXStreet and the author will not be liable for any errors, omissions or any losses, injuries or damages arising from this information and its display or use. Errors and omissions excepted.

The author and FXStreet are not registered investment advisors and nothing in this article is intended to be investment advice.

Recommended content


Recommended content

Editors’ Picks

EUR/USD clings to daily gains above 1.0650

EUR/USD clings to daily gains above 1.0650

EUR/USD gained traction and turned positive on the day above 1.0650. The improvement seen in risk mood following the earlier flight to safety weighs on the US Dollar ahead of the weekend and helps the pair push higher.

EUR/USD News

GBP/USD recovers toward 1.2450 after UK Retail Sales data

GBP/USD recovers toward 1.2450 after UK Retail Sales data

GBP/USD reversed its direction and advanced to the 1.2450 area after touching a fresh multi-month low below 1.2400 in the Asian session. The positive shift seen in risk mood on easing fears over a deepening Iran-Israel conflict supports the pair.

GBP/USD News

Gold holds steady at around $2,380 following earlier spike

Gold holds steady at around $2,380 following earlier spike

Gold stabilized near $2,380 after spiking above $2,400 with the immediate reaction to reports of Israel striking Iran. Meanwhile, the pullback seen in the US Treasury bond yields helps XAU/USD hold its ground.

Gold News

Bitcoin Weekly Forecast: BTC post-halving rally could be partially priced in Premium

Bitcoin Weekly Forecast: BTC post-halving rally could be partially priced in

Bitcoin price shows no signs of directional bias while it holds above  $60,000. The fourth BTC halving is partially priced in, according to Deutsche Bank’s research. 

Read more

Week ahead – US GDP and BoJ decision on top of next week’s agenda

Week ahead – US GDP and BoJ decision on top of next week’s agenda

US GDP, core PCE and PMIs the next tests for the Dollar. Investors await BoJ for guidance about next rate hike. EU and UK PMIs, as well as Australian CPIs also on tap.

Read more

Forex MAJORS

Cryptocurrencies

Signatures