Gold Price Analysis: XAU/USD bulls lacking conviction despite stimulus hopes, levels to watch – Confluence Detector

Gold (XAU/USD) is building on Friday’s rebound above $1800, as the US dollar remains pressured amid mixed US employment data. Democrats going ahead with President Biden’s $1.9 trillion stimulus package, in what’s called a reconciliation procedure, favors the bulls.
However, the rally in the US rates, driven by the reduced demand for Treasuries amid reflation trades, could cap the recovery in the metal from two-month lows of $1785. How is gold positioned on the technical charts?
Gold Price Chart: Key resistances and supports
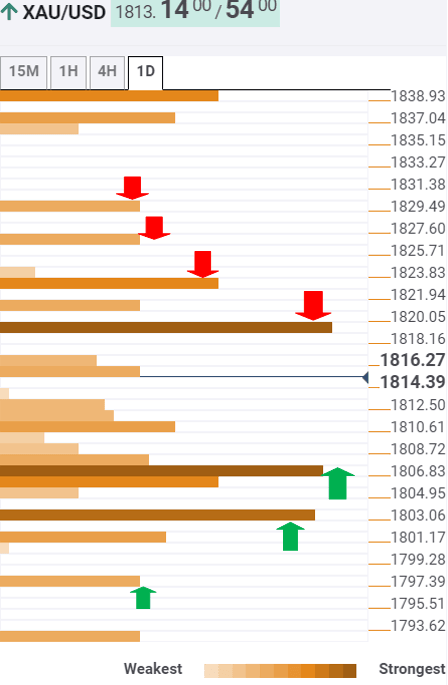
The Technical Confluences Indicator shows that gold has advanced to test a minor resistance around $1816, which is the previous day high.
If the buyers find a foothold above that level, the next powerful hurdle at $1820 could be put to test. That level is the meeting point of the Fibonacci 38.2% one-week, previous high four-hour and Bollinger one-hour Upper.
Further up, the SMA100 one-hour at $1823 would challenge the bullish commitments, opening doors towards $1827, the SMA5 one-day. A break above the latter could test the pivot point one-day R2 at $1829.
Alternatively, immediate support is aligned at $1810, which is the convergence of the previous low one-hour and Fibonacci 23.65 one-day.
Sellers would then target strong support at $1807, the intersection of the SMA50 one-hour, Fibonacci 23.6% one-week and Fibonacci 38.2% one-day.
The previous month low at $1803 could lend some support, below which the pivot point one-day S1 at $1800 would be in play once again.
Here is how it looks on the tool
About Confluence Detector
The TCI (Technical Confluences Indicator) is a tool to locate and point out those price levels where there is a congestion of indicators, moving averages, Fibonacci levels, Pivot Points, etc. Knowing where these congestion points are located is very useful for the trader, and can be used as a basis for different strategies.
Author

Dhwani Mehta
FXStreet
Residing in Mumbai (India), Dhwani is a Senior Analyst and Manager of the Asian session at FXStreet. She has over 10 years of experience in analyzing and covering the global financial markets, with specialization in Forex and commodities markets.


