Gold Price Analysis: XAU/USD bears eye $1,670 as Treasury yields rebound – Confluence Detector

Gold recently refreshed intraday low to $1,706.68, before bouncing off to $1,708, during early Thursday. The yellow metal dropped to the fresh low since June 2020 the previous day as market sentiment dwindled amid a fresh run-up in the Treasury yields that propelled the US dollar and disappointing commodities.
Behind the moves could be the hopes of a heavy inflow of funds due to the recent UK budget and upcoming US stimulus. Also on the same line could be the central bankers’ efforts to tame the bond bears.
The risk-off moves gained extra support during Asia amid chatters of progress in the US covid relief package and an abrupt off in the US House amid a rumored plot to attack Capitol Hill.
As a result, S&P 500 Futures join stocks in Asia-Pacific to mark losses whereas the US 10-year Treasury yields remain firmly directed towards 1.50%.
Moving on, Fed Chair Jerome Powell’s speech at 17:05 will be the key to confirm the reflation fears and hence will be watched closely ahead of Friday’s NFP.
Gold: Key levels to watch
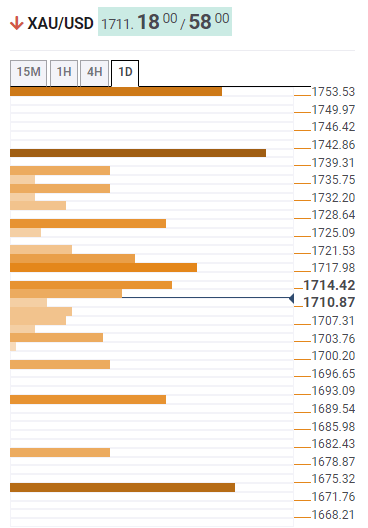
The Technical Confluences Indicator suggests the uphill battle for the gold prices unless providing a clear break above $1,743 as multiple hurdles to the north joins US dollar strength to favor gold sellers.
Among them, 38.2% Fibonacci retracement on daily (1D) and the previous high on the four-hour (4H) and hourly (1H) formations join the upper band of the Bollinger on the 15-minute chart to highlight $1,718 as an immediate key hurdle.
Following that, 61.8% Fibonacci retracement of 1D and SMA10 on 4H offers $1,729-30 as an extra resistance before fueling the bullion to the key $1,743 upside barrier comprising 23.6% Fibonacci retracement on a weekly (1W) and previous high on 1D.
Meanwhile, the $1,700 round-figure can tease the gold bears before directing them to the Pivot Point’s first support, S1, on the W1 near $1,693.
Though, the bullion’s further downside will witness strong support of around $1,670, including Pivot Point S1 for the monthly (1Month) formation.
Here is how it looks on the tool
About Technical Confluences Detector
The TCD (Technical Confluences Detector) is a tool to locate and point out those price levels where there is a congestion of indicators, moving averages, Fibonacci levels, Pivot Points, etc. Knowing where these congestion points are located is very useful for the trader, and can be used as a basis for different strategies.
Author

Anil Panchal
FXStreet
Anil Panchal has nearly 15 years of experience in tracking financial markets. With a keen interest in macroeconomics, Anil aptly tracks global news/updates and stays well-informed about the global financial moves and their implications.