Gold Price Analysis: Battle lines well-defined for XAU/USD after Yellen-led hit – Confluence Detector

Gold (XAU/USD) is on a steady recovery towards the $1800 mark, as the US dollar retreats across the board amid improving market mood. The US tech sell-off combined with Treasury Secretary Janet Yellen’s rate hike comments rattled markets and boosted the safe-haven greenback at gold’s expense. Upbeat US Factory data also backed the dollar’s gains.
Gold took a sharp U-turn after running into the $1800 technical resistance once again. Let's see how the metal is positioned on the charts, with all eyes on the US ADP jobs report and ISM Services PMI.
Gold Price Chart: Key resistance and support levels
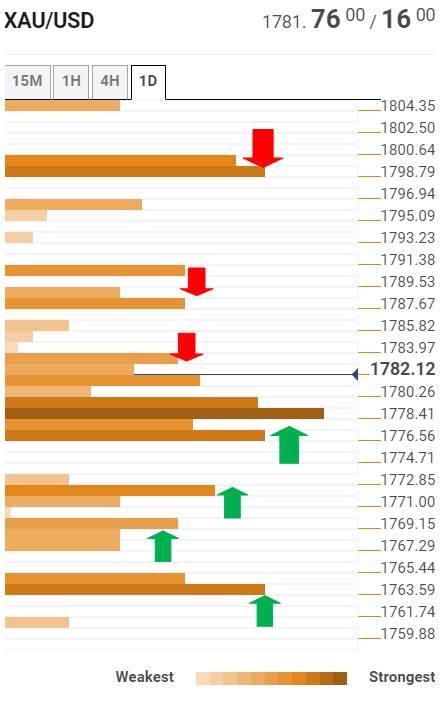
The Technical Confluences Detector shows that gold has managed to clear a dense cluster of resistance levels now support zone around $1777-$1780.
That area is the intersection of the Fibonacci 23.6% one-day, Fibonacci 61.8% one-week and SMA50 four-hour.
At the time of writing, the metal is battling strong resistance around $1782, which is the convergence of the Fibonacci 38.2% one-day and SMA10 one-day.
Further up, the pivot point one-week R1 at $1787 could be challenged, in order to retest the $1800 key barrier.
However, the previous week high at $1790 could limit the advances.
On the flip side, if the abovementioned demand area is breached on a sustained basis, a test of the previous day low of $1770 cannot be ruled out.
The Fibonacci 38.2% one-week at $1768 could be next on the sellers’ radars.
The next critical support awaits at 1764, the confluence of the Fibonacci 23.6% one-week and Fibonacci 38.2% one-month.
Here is how it looks on the tool
About Technical Confluences Detector
The TCD (Technical Confluences Detector) is a tool to locate and point out those price levels where there is a congestion of indicators, moving averages, Fibonacci levels, Pivot Points, etc. Knowing where these congestion points are located is very useful for the trader, and can be used as a basis for different strategies.
Author

Dhwani Mehta
FXStreet
Residing in Mumbai (India), Dhwani is a Senior Analyst and Manager of the Asian session at FXStreet. She has over 10 years of experience in analyzing and covering the global financial markets, with specialization in Forex and commodities markets.


