Gold Price Analysis: $1754 support holds the key for XAU/USD amid the corrective decline – Confluence Detector

Gold (XAU/USD) is on a steady corrective decline so far this Friday, weighed down by a 5bps recovery rally in the US 10-year Treasury yields, Meanwhile, mixed Chinese data and growing covid concerns worldwide re-ignite the haven demand for the US dollar, exerting additional downward pressure on gold.
Gold reached two-month highs at $1770 on Thursday, underpinned by the dovish Fed expectations that fuelled a sell-off in the US rates across the curve. Focus shifts to the US UoM Consumer Sentiment data for fresh cues on gold.
In the meantime, let’s see how is the metal positioned on the technical graphs?
Gold Price Chart: Key resistance and support levels
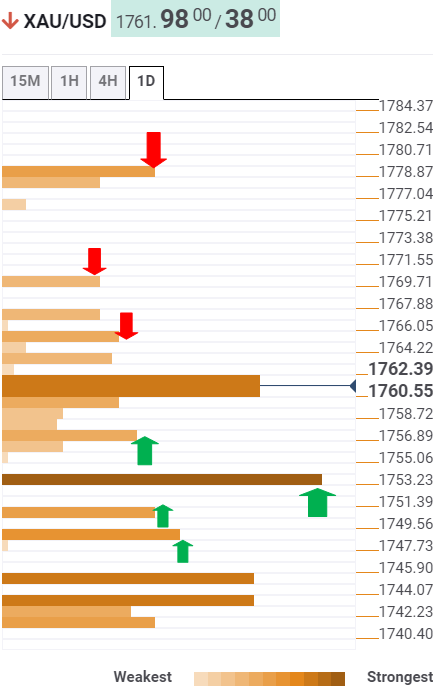
The Technical Confluences Detector shows that gold is battling key support around $1760, which is the convergence of the previous month high, Fibonacci 23.6% one-day and pivot point one-week R1.
The next cushion is seen at the Fibonacci 38.2% one-day at $1756.
Further south, the sellers need acceptance below $1754 to negate the near-term upbeat momentum. That level is the intersection of the SMA50 one-day and pivot point one-month R1.
The Fibonacci 23.6% one-week at $1750 could help limit the corrective pullback.
The bears could test the bullish commitments at $1748, the meeting point of the Fibonacci 61.8% one-day and SMA50 one-hour.
Alternatively, if the uptrend resumes, the immediate resistance is aligned at the previous high four-hour at $1765.
Further up, the two-month tops at $1770 could offer stiff resistance, above which a rally towards the pivot point one-day R1 at $1778 cannot be ruled out.
Here is how it looks on the tool
About Technical Confluences Detector
The TCD (Technical Confluences Detector) is a tool to locate and point out those price levels where there is a congestion of indicators, moving averages, Fibonacci levels, Pivot Points, etc. Knowing where these congestion points are located is very useful for the trader, and can be used as a basis for different strategies.
Author

Dhwani Mehta
FXStreet
Residing in Mumbai (India), Dhwani is a Senior Analyst and Manager of the Asian session at FXStreet. She has over 10 years of experience in analyzing and covering the global financial markets, with specialization in Forex and commodities markets.