General Electric Co ($GE) reacts higher from the blue box area

Hello everyone. In today’s article, we will look at the past performance of the 1 Hour Elliott Wave chart of General Electric Co. ($GE) The rally from 6.23.2023 low unfolded as a 5 wave impulse with an incomplete bullish sequence from 7.19.2023 low. So, we advised members to buy the pullback in 7 swings at the blue box area ($112.75 – 109.95). We will explain the structure & forecast below:
$GE 1H Elliott Wave chart 8.01.2023
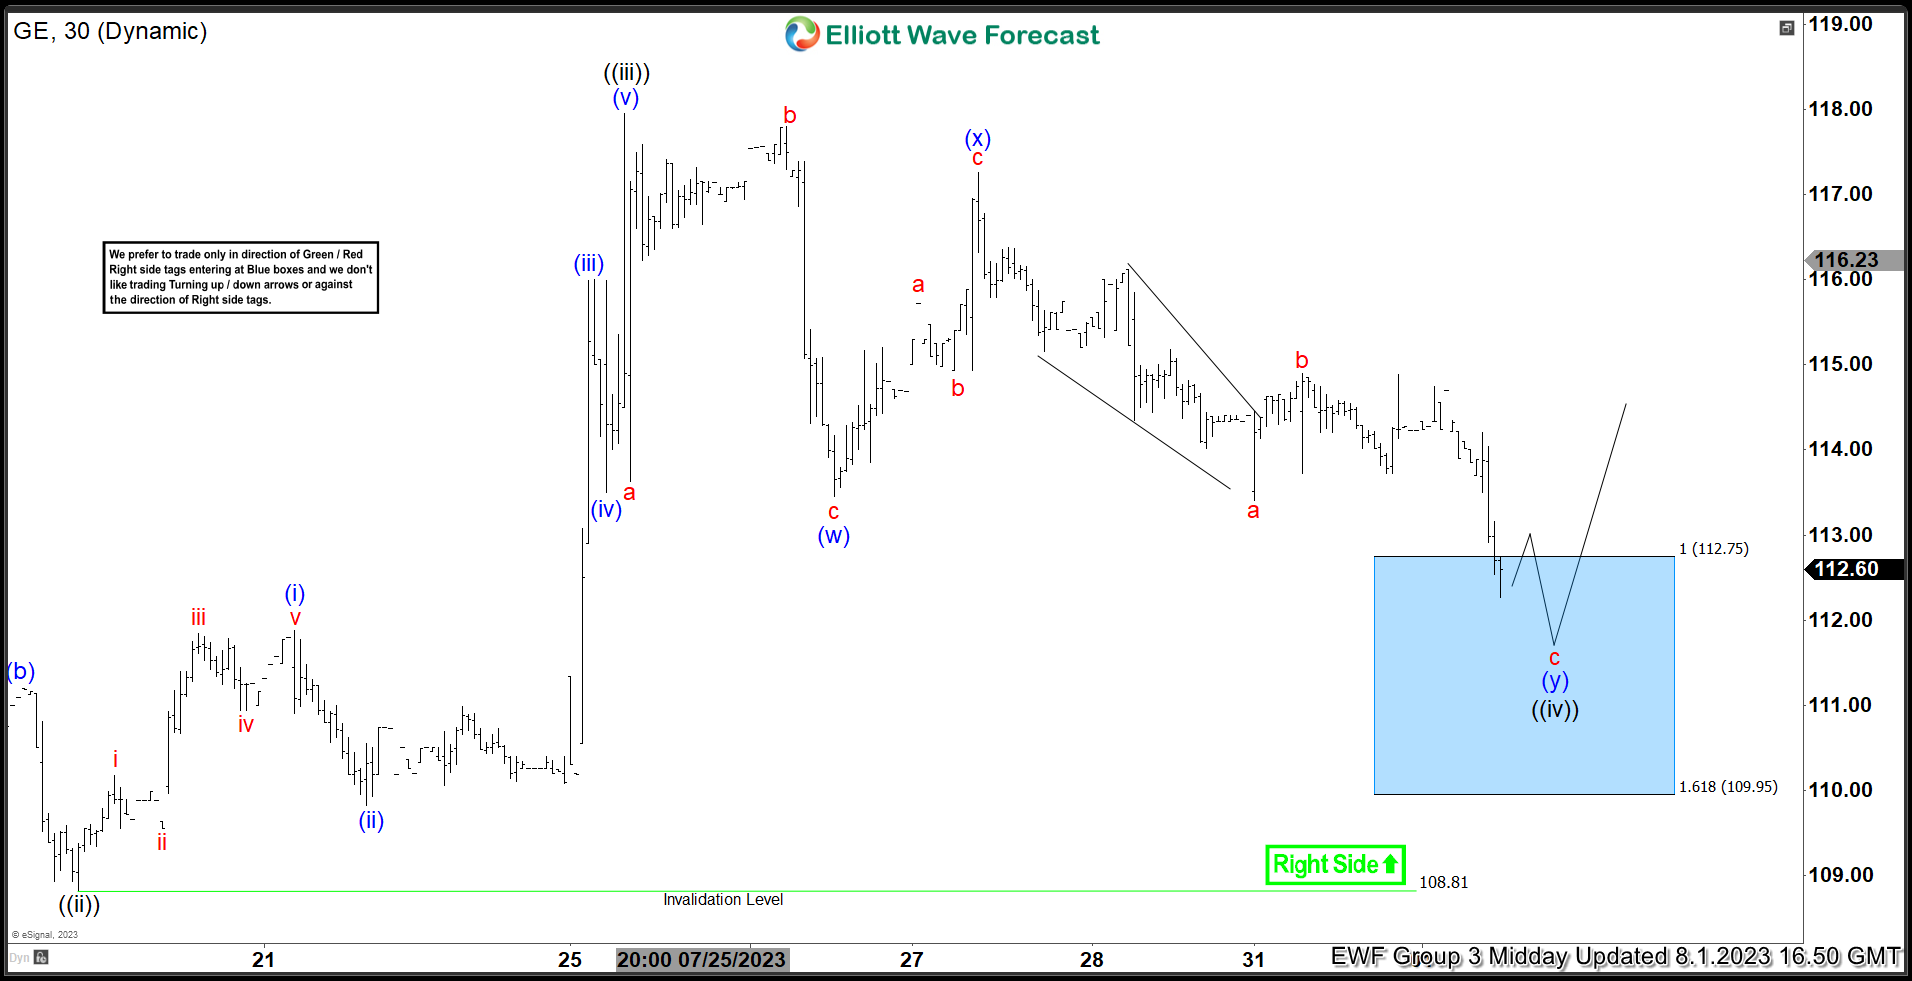
Here is the 1H Elliott Wave count from 8.01.2023. The rally from 7.19.2023 at black ((ii)) unfolded in a 5 wave impulse which signaled a bullish trend. We expected the pullback to find buyers in 7 swings at $112.75 – 109.95 where we entered as buyers.
$GE latest 1H Elliott Wave chart 8.08.2023
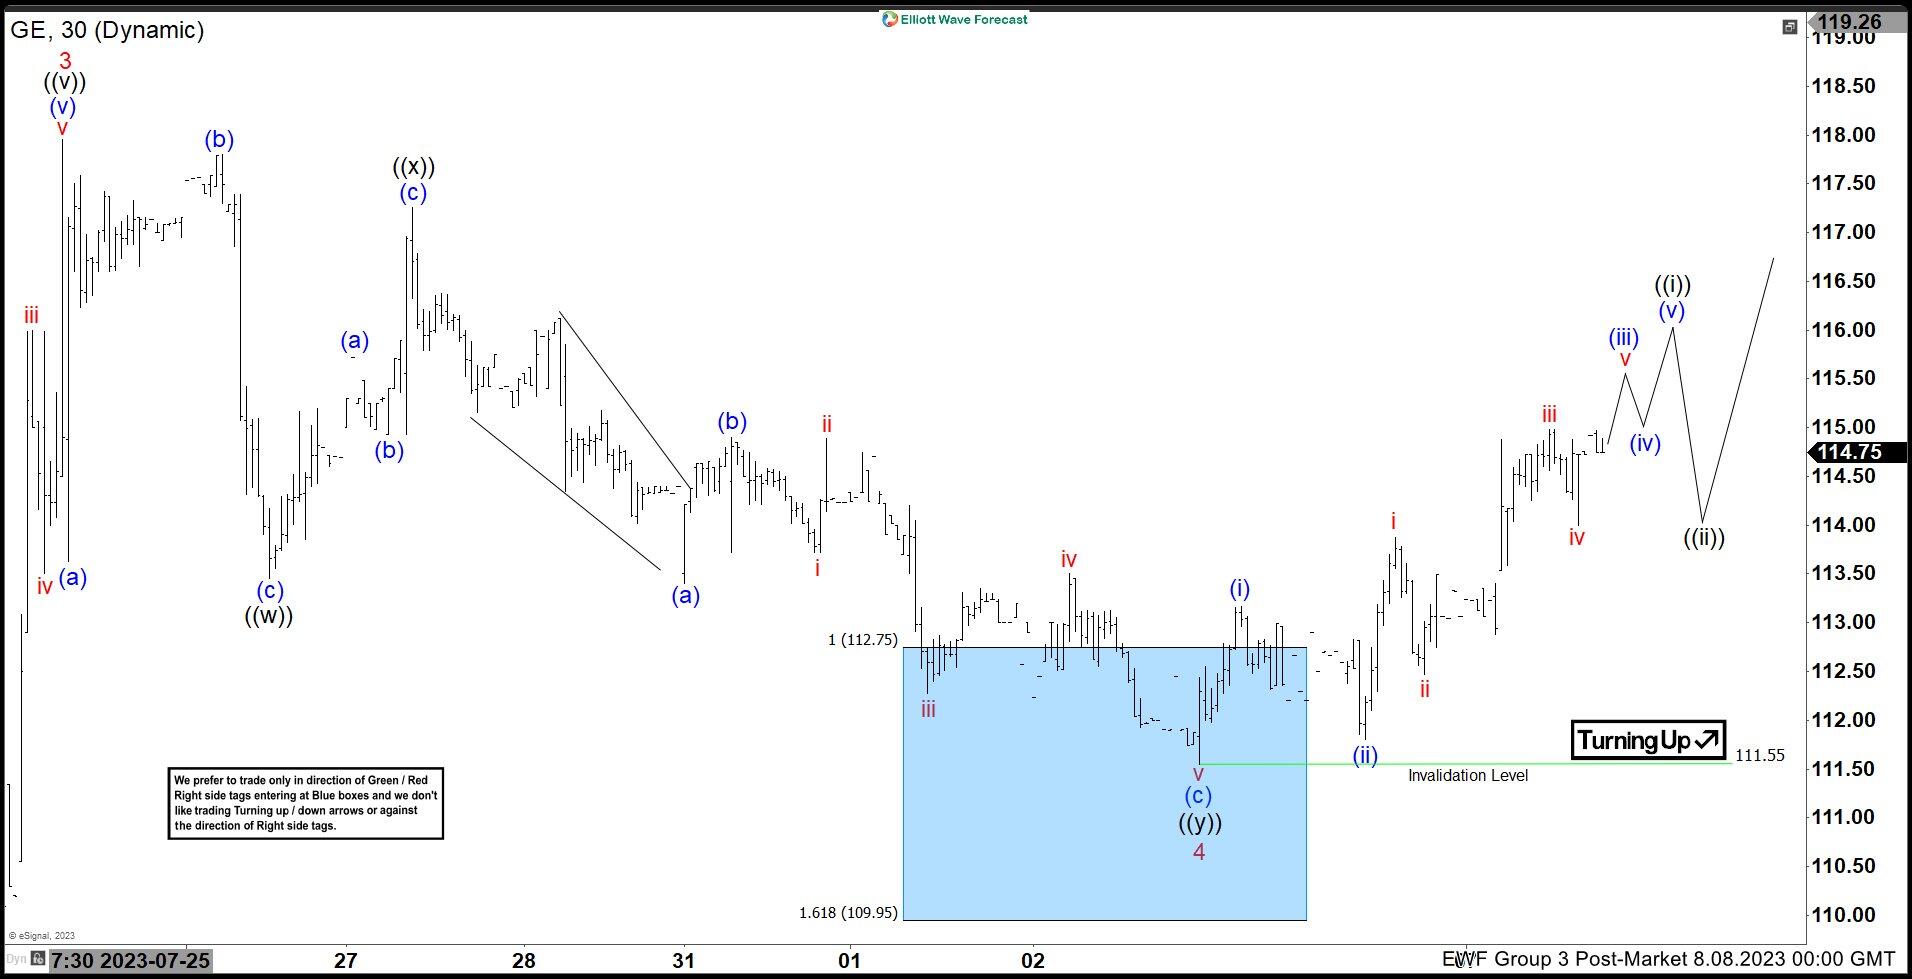
Here is the latest 1H update from 8.08.2023 showing the move taking place as expected. The stock has reacted higher from the blue box allowing longs to get a risk free position. The pullback can become 11 swings where we will like to buy it again should that happen. Near term, we like it higher towards a new high for the year towards $119 before another pullback can happen.
Premium
You have reached your limit of 3 free articles for this month.
Start your subscription and get access to all our original articles.
Author

Elliott Wave Forecast Team
ElliottWave-Forecast.com


